UK since 2007
The overview combines eight source-backed indicators, including official statistics, charity administrative counts and a constructed tuition-fee series. It uses 2007 as the common framing; each panel uses its own available baseline and latest year. It is not a composite index or an exhaustive measure of UK performance. Colours describe the selected direction of change between endpoints, not the latest annual trend. The overview uses year-only labels: financial and academic years use their starting year; pooled trust surveys and CSEW periods use their ending year. Monthly waiting-list and company counts use the latest available snapshot in each year. These periods are not interchangeable annual observations.
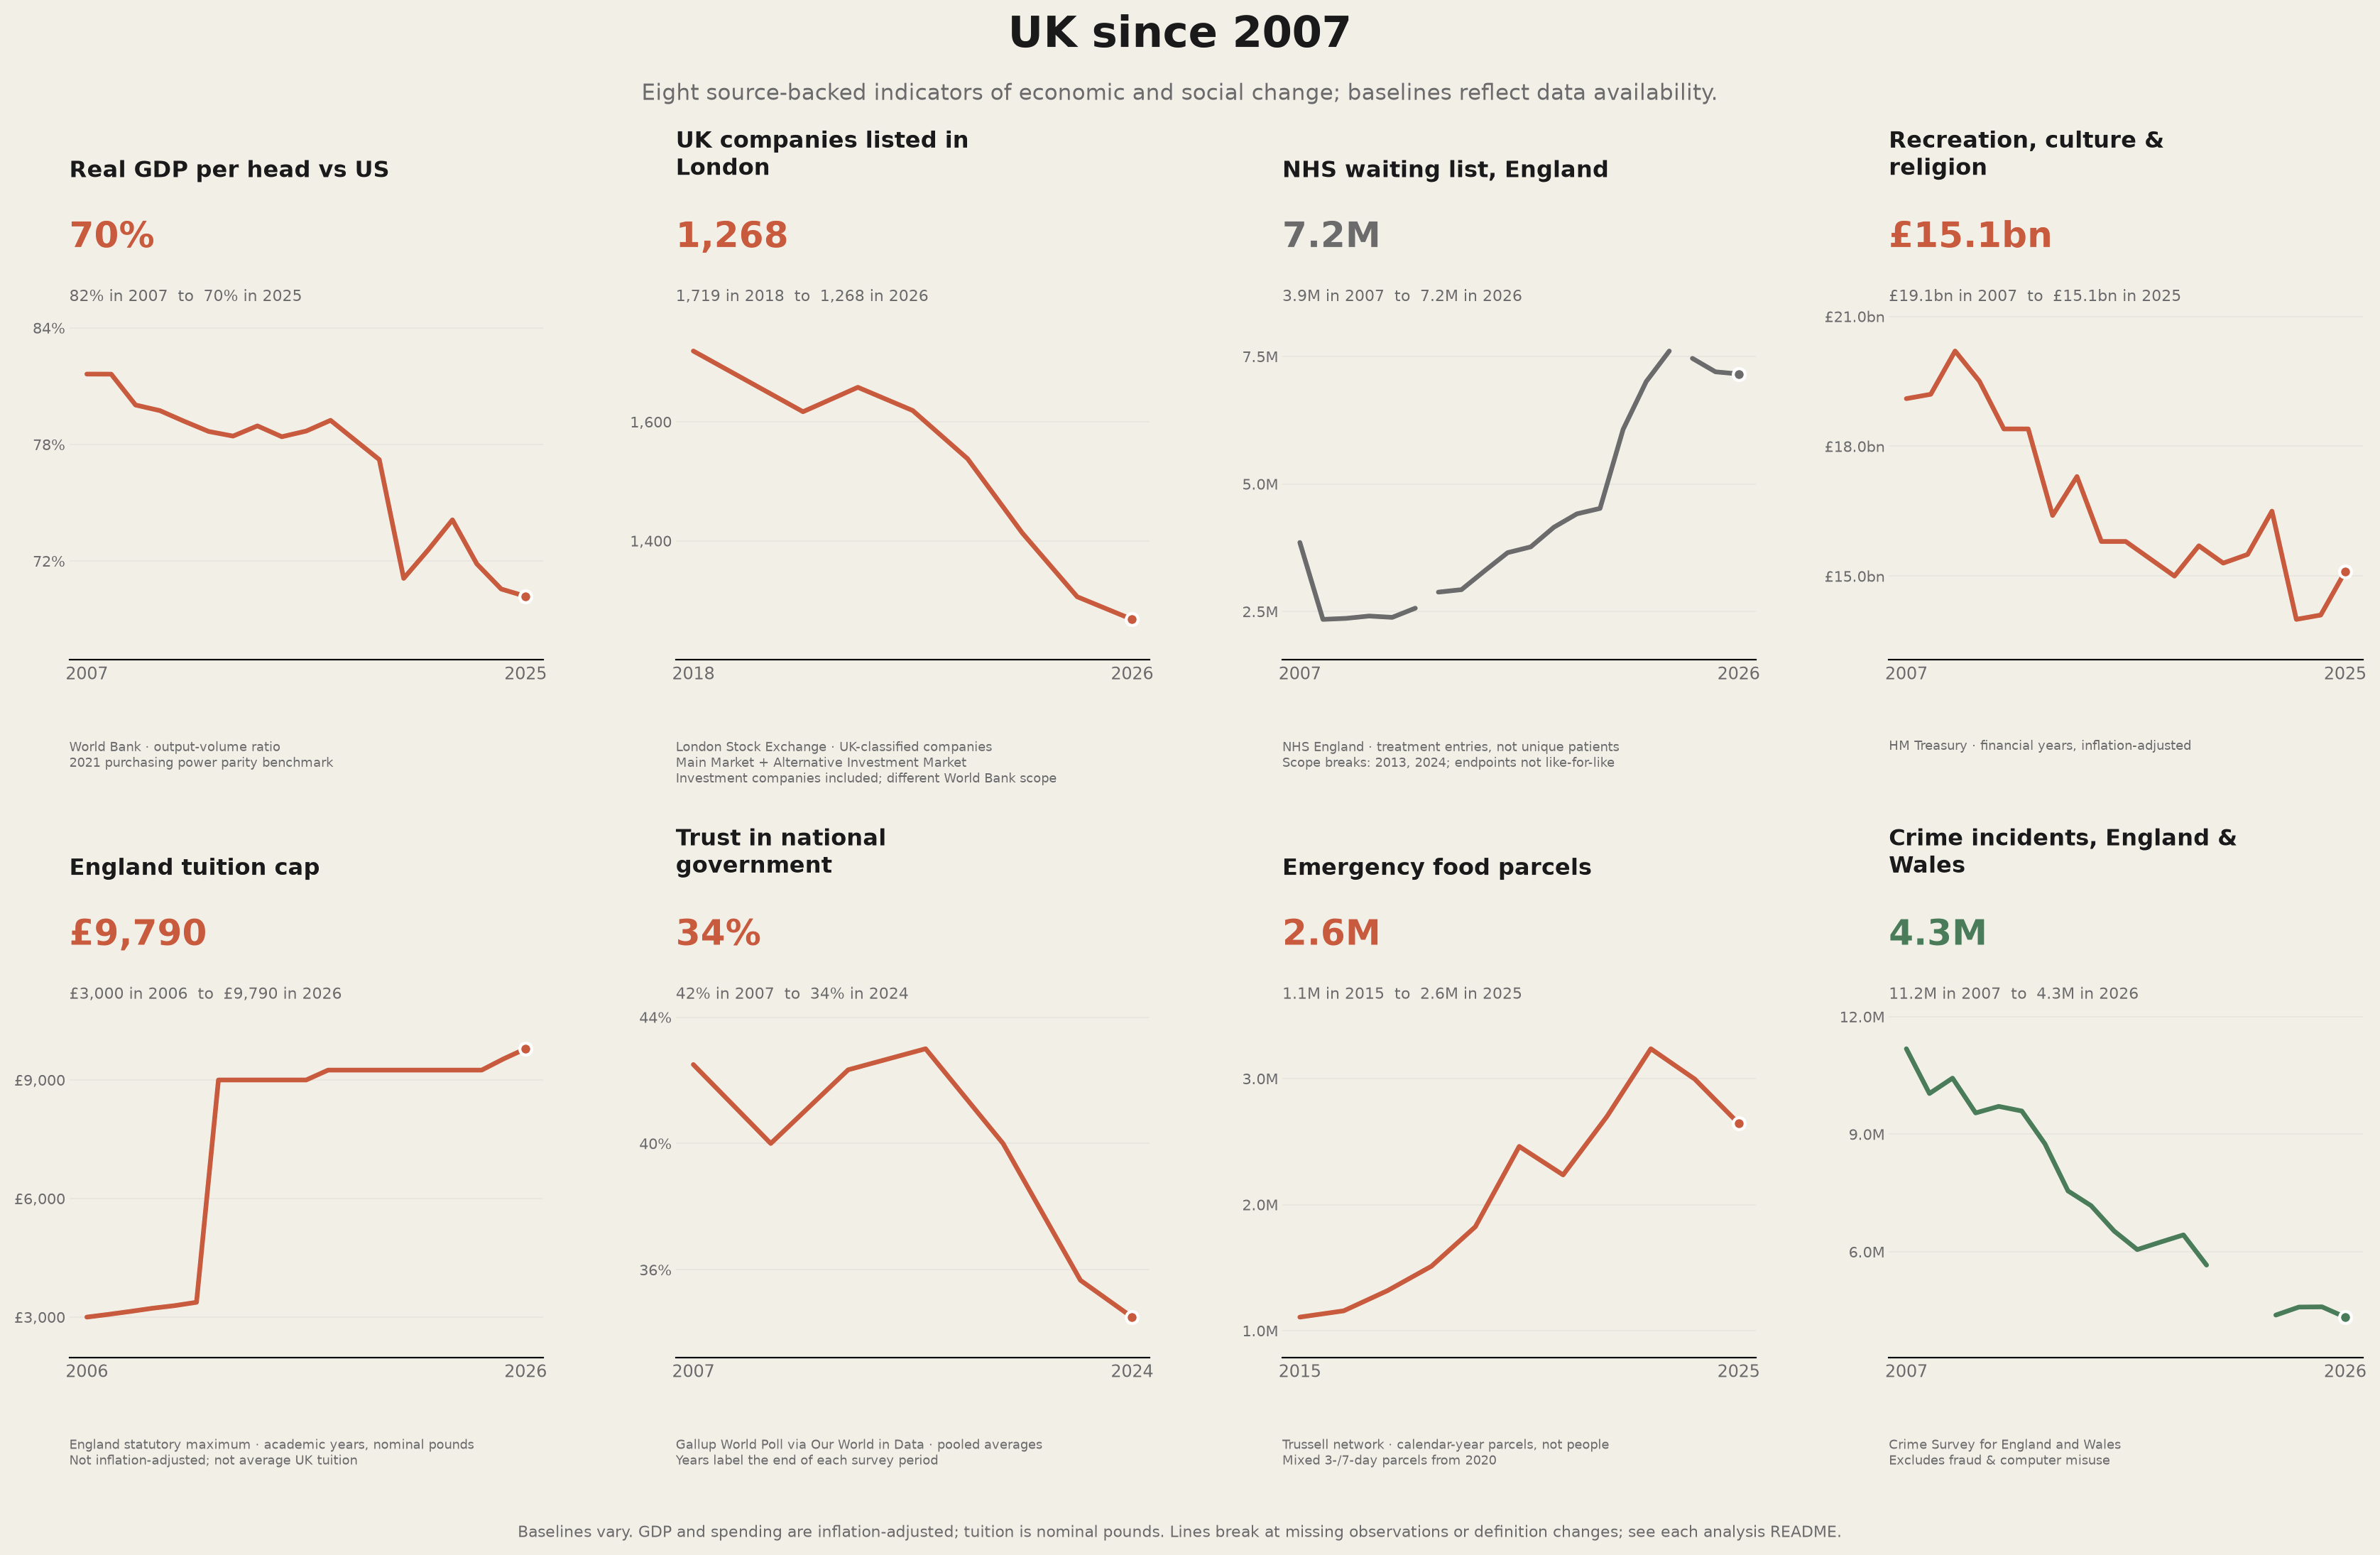
The GDP comparison uses constant-price purchasing-power parity (PPP), not market-exchange-rate dollars, so sterling movements are not mistaken for relative changes in economic output. The tuition panel shows the England undergraduate fee cap in nominal pounds, through £9,790 for 2026/27. It is not inflation-adjusted or average UK tuition. The separate tuition analysis retains the real-dollar history, which ends earlier because it requires same-year annual exchange rates and US CPI. The NHS waiting list counts entries awaiting consultant-led treatment, not unique patients. It excludes non-consultant-led pathways and estimates for missing providers; the latest snapshot is August 2026. Trussell figures count parcels distributed by its network, not unique recipients or all UK food-bank provision. The listed-company panel uses LSE-classified UK companies on the Main Market and AIM, including investment companies: 1,719 in December 2018 to 1,268 in July 2026. It starts after the Main Market's May 2018 coverage change. This is not the World Bank/WFE definition; the separate international charts retain WDI counts, and the two sources are never spliced. See the stock-market analysis for the sources and exact dates.
The GDP ratio represents real output volumes valued at the 2021 PPP benchmark, not median household income or annually repriced purchasing power. The GDP analysis separates national-accounts real growth from nominal dollar valuations; the PPP analysis adds a 2007 = 100 growth chart and documents the methodological research and validation.
The crime panel shows estimated incidents in England & Wales, excluding fraud and computer misuse, from ONS Crime Survey Table A1a: 11.2 million in the year ending March 2007 to 4.3 million in the year ending March 2026. Lower counts are shown as an improvement. This is a long-run survey measure, not all UK crime, a police-recorded total, or the percentage of people victimised; it does not cover every offence type. See the crime analysis for coverage and the separate series including fraud and computer misuse.
Explore the evidence
Economy and living standards: GDP and incomes, stock markets, sterling, trade, London's economy, and purchasing power parity. Government debt and borrowing costs distinguish the UK public-debt stock relative to GDP from market yields on government bonds.
Public services and infrastructure: austerity, NHS performance, and rail performance.
Household pressure: tax, tuition, and food-bank use.
Population and institutions: migration, ageing, crime, and institutional trust.