Economy
GDP & incomes
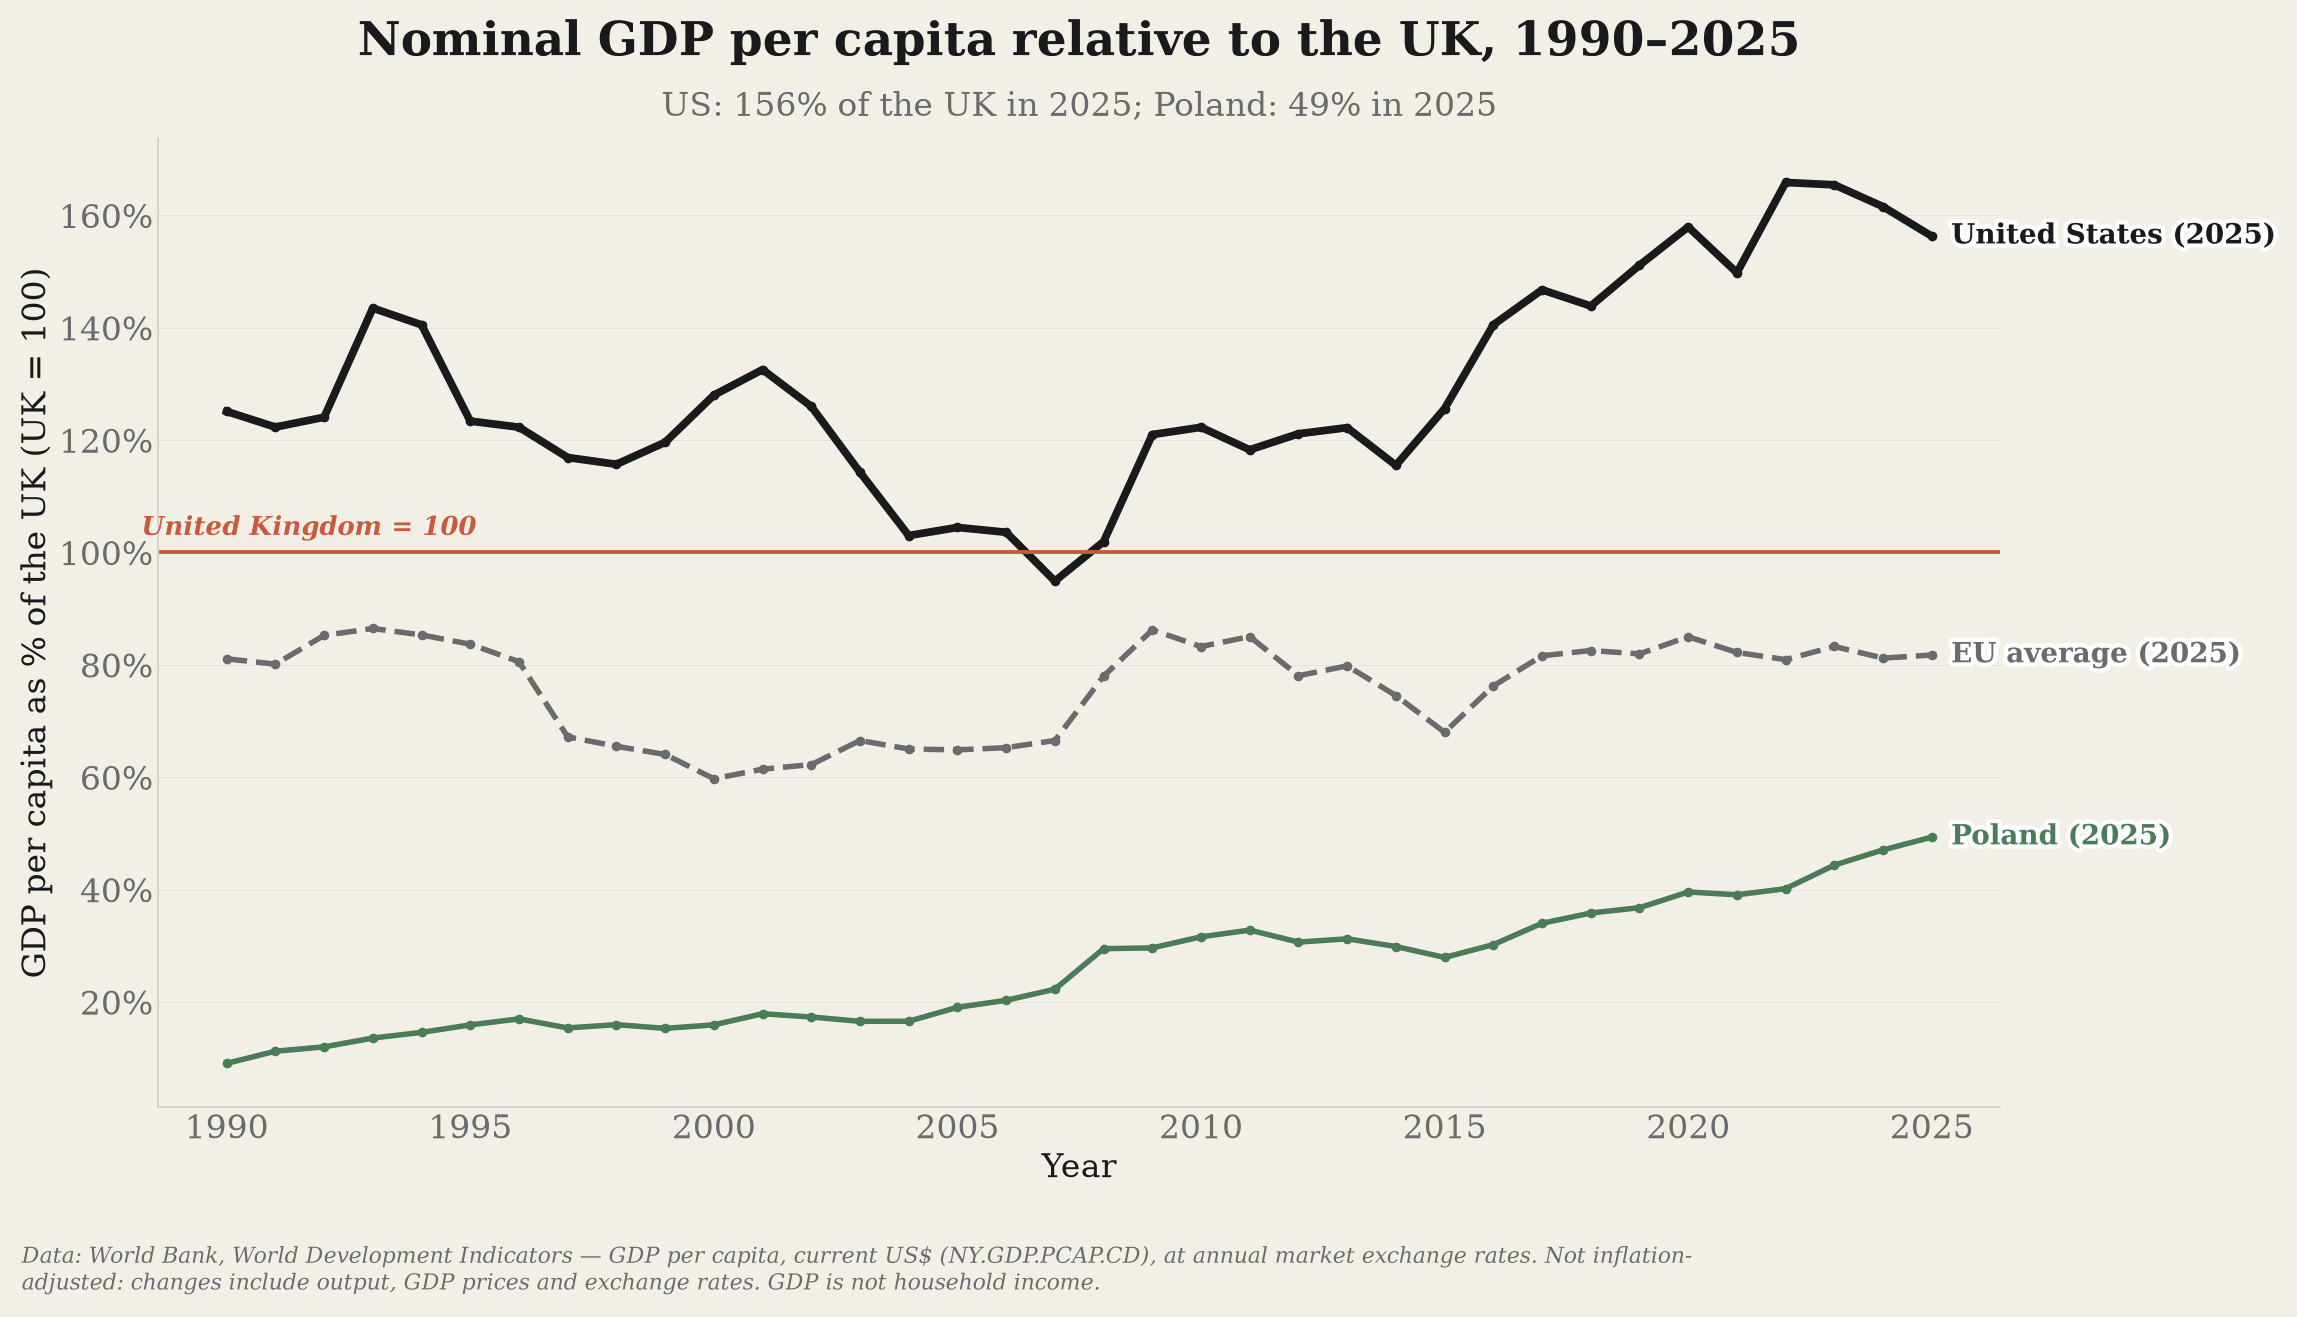
Real output, nominal valuations and household incomes answer different questions.
A source-backed view of the United Kingdom
Explore the economy, public services, household pressures and institutions.
Explore the evidenceThe overview
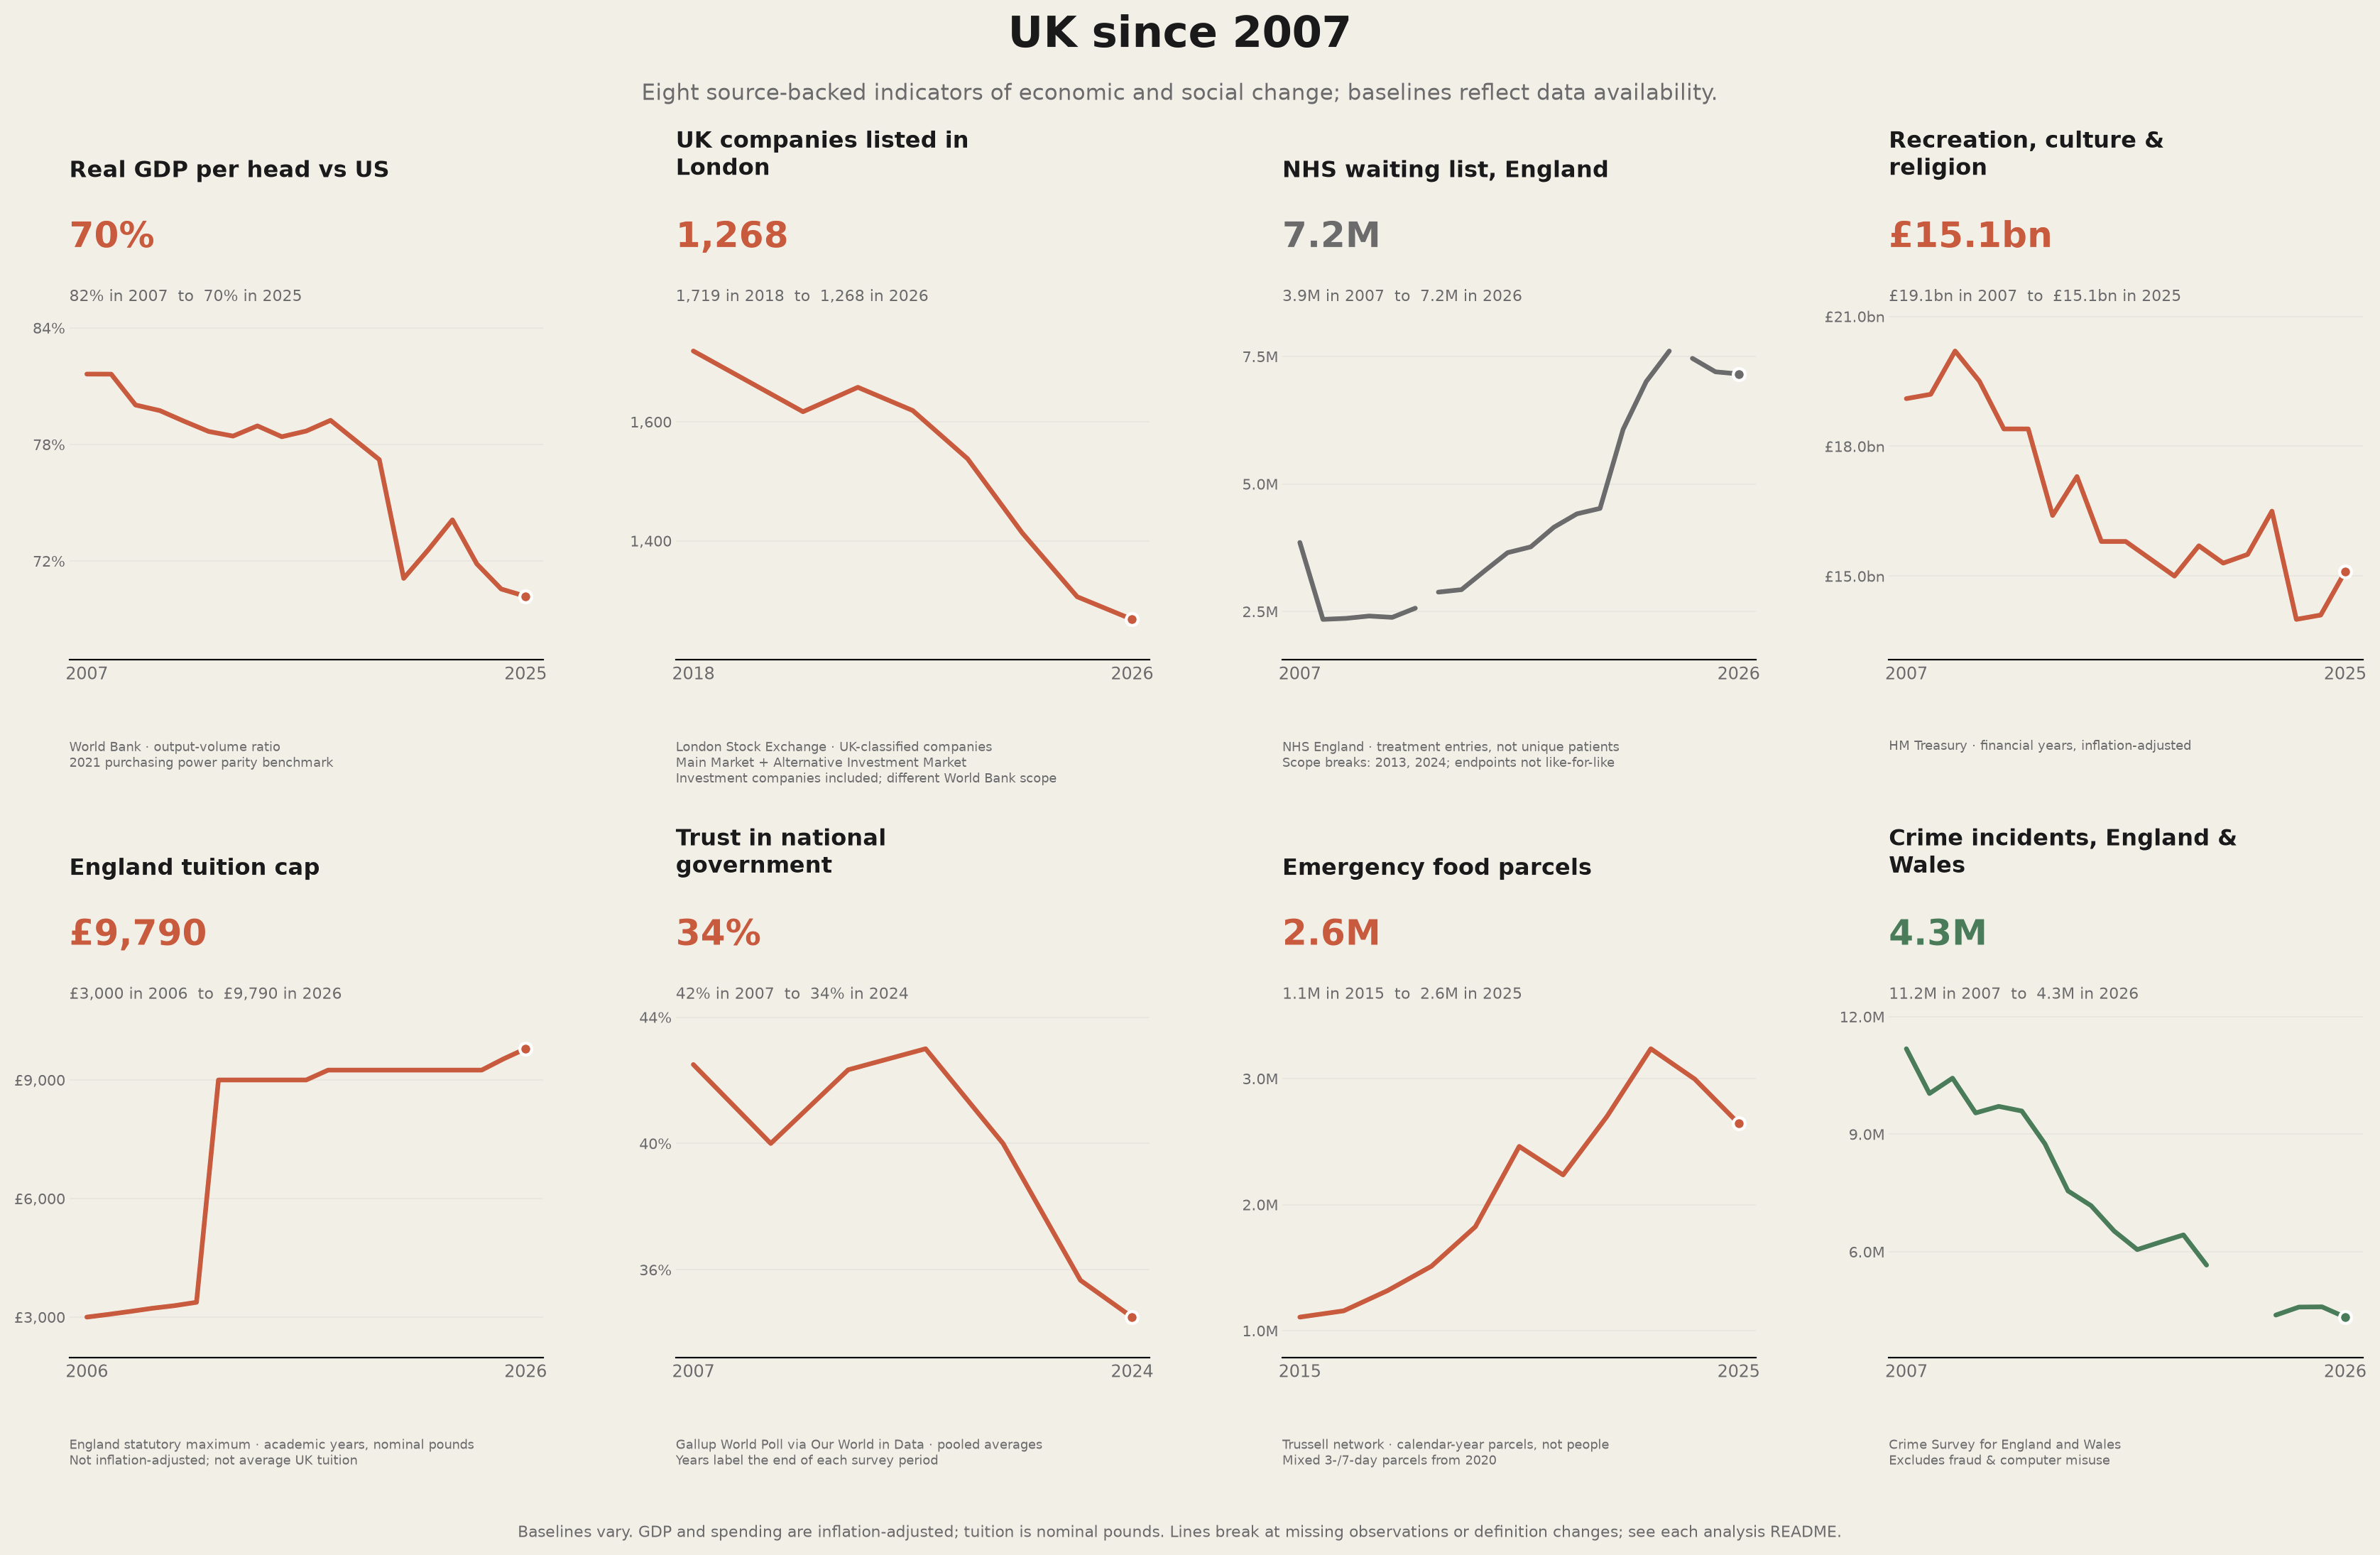
Eight selected indicators, not a composite score or an exhaustive assessment of UK performance. Baselines, periods and geographic coverage differ. Open the chart for full resolution.
Go beyond the headline
17 analyses · charts, data and source notes
Real output, nominal valuations and household incomes answer different questions.
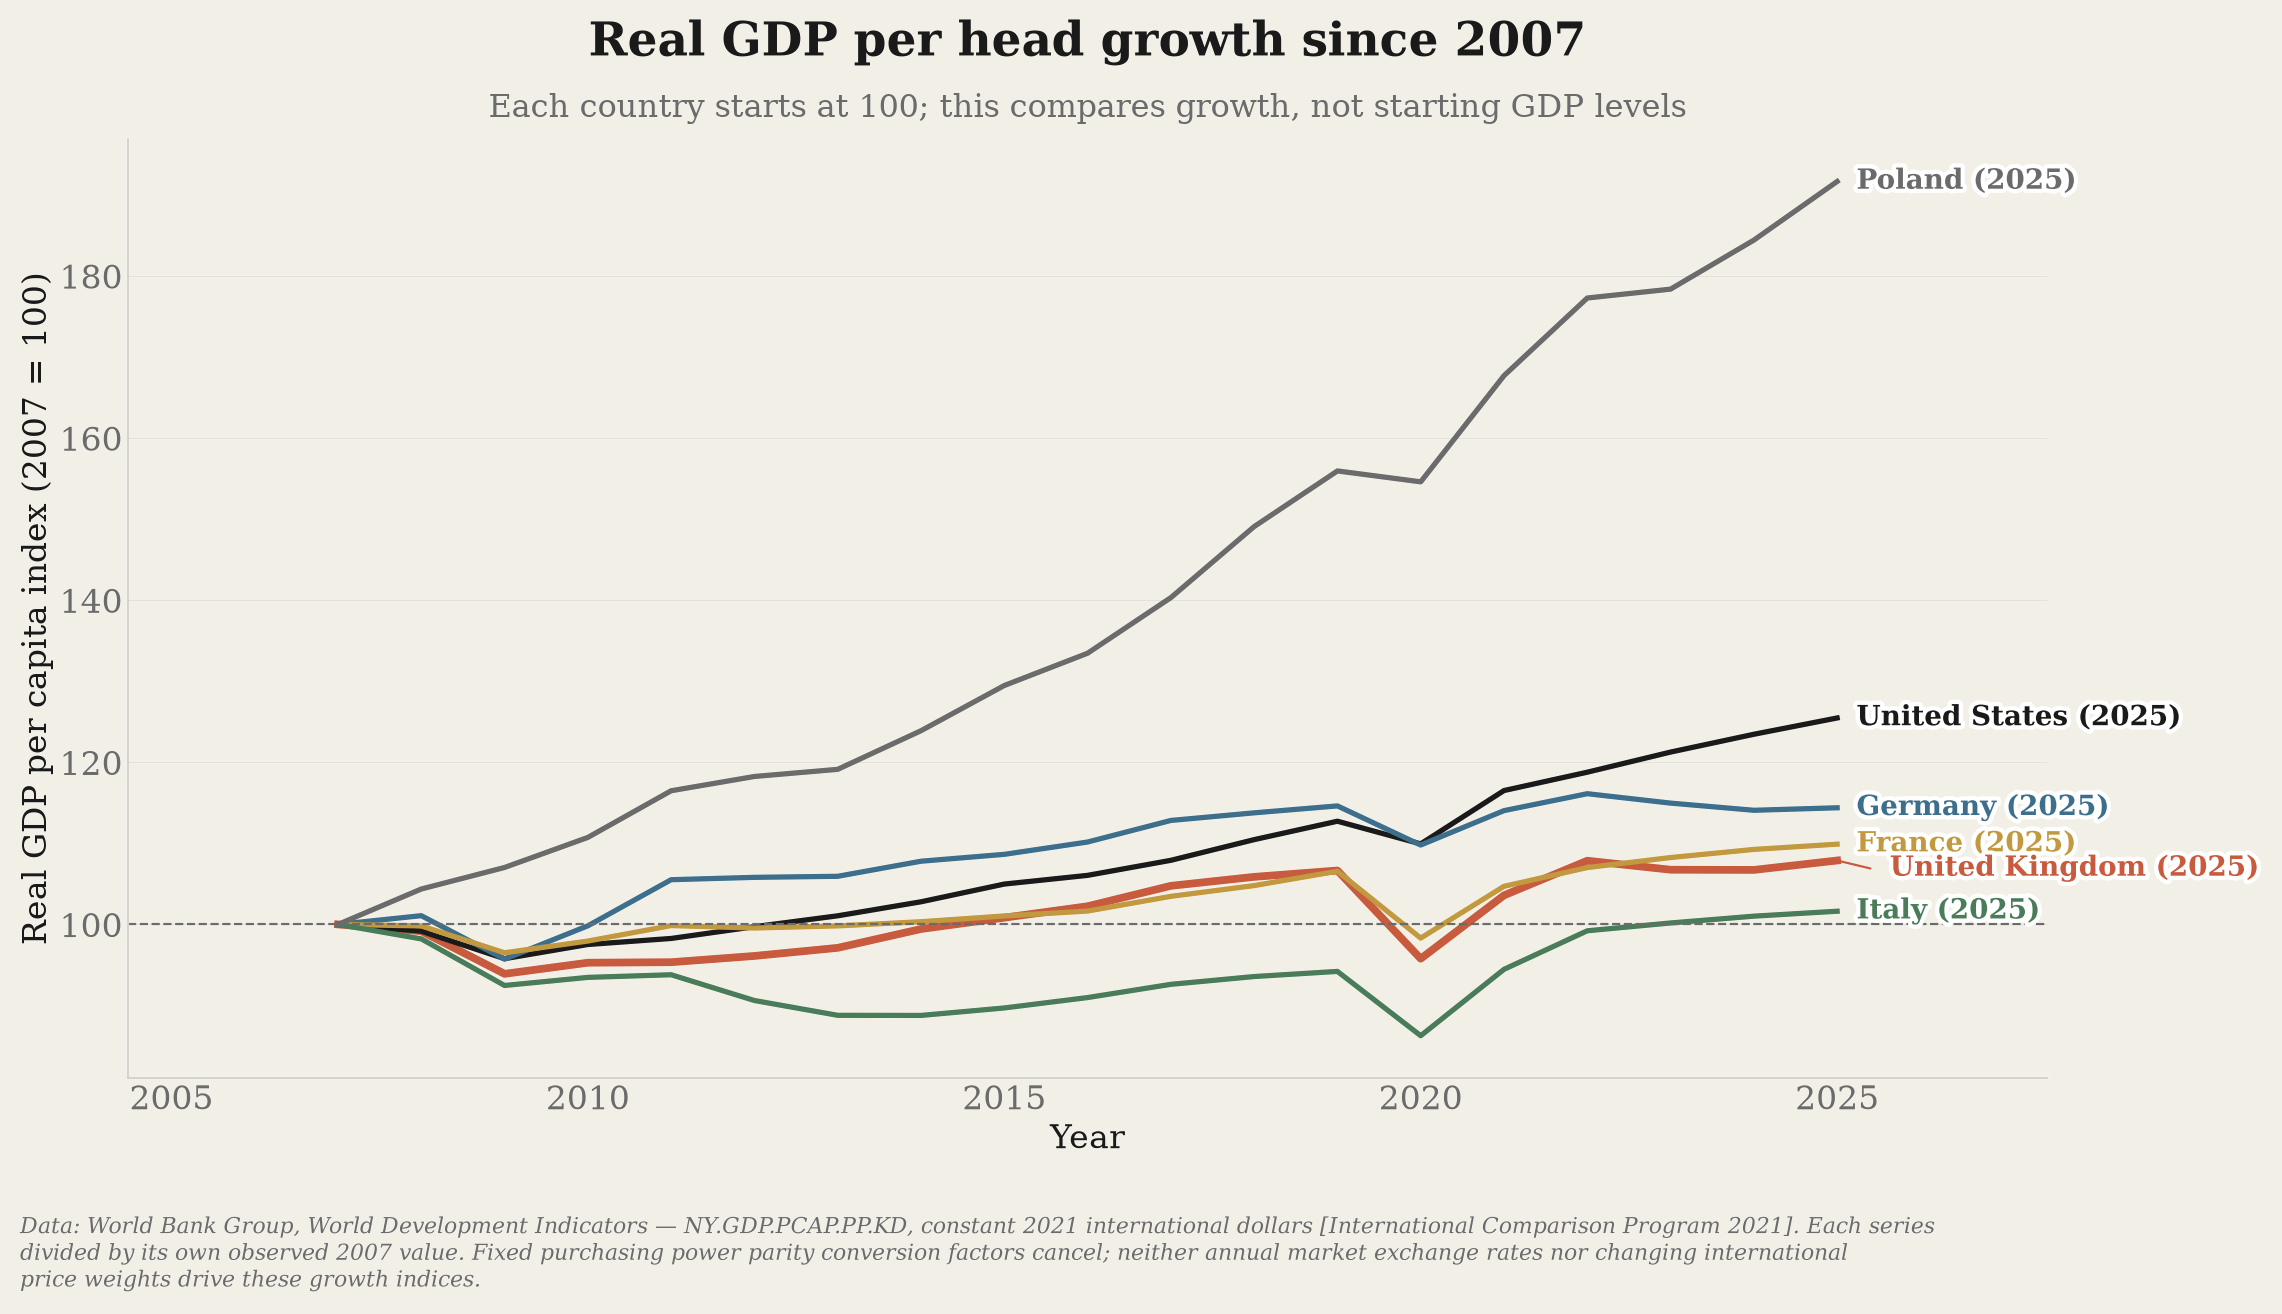
Separate real economic growth from exchange rates and relative price levels.
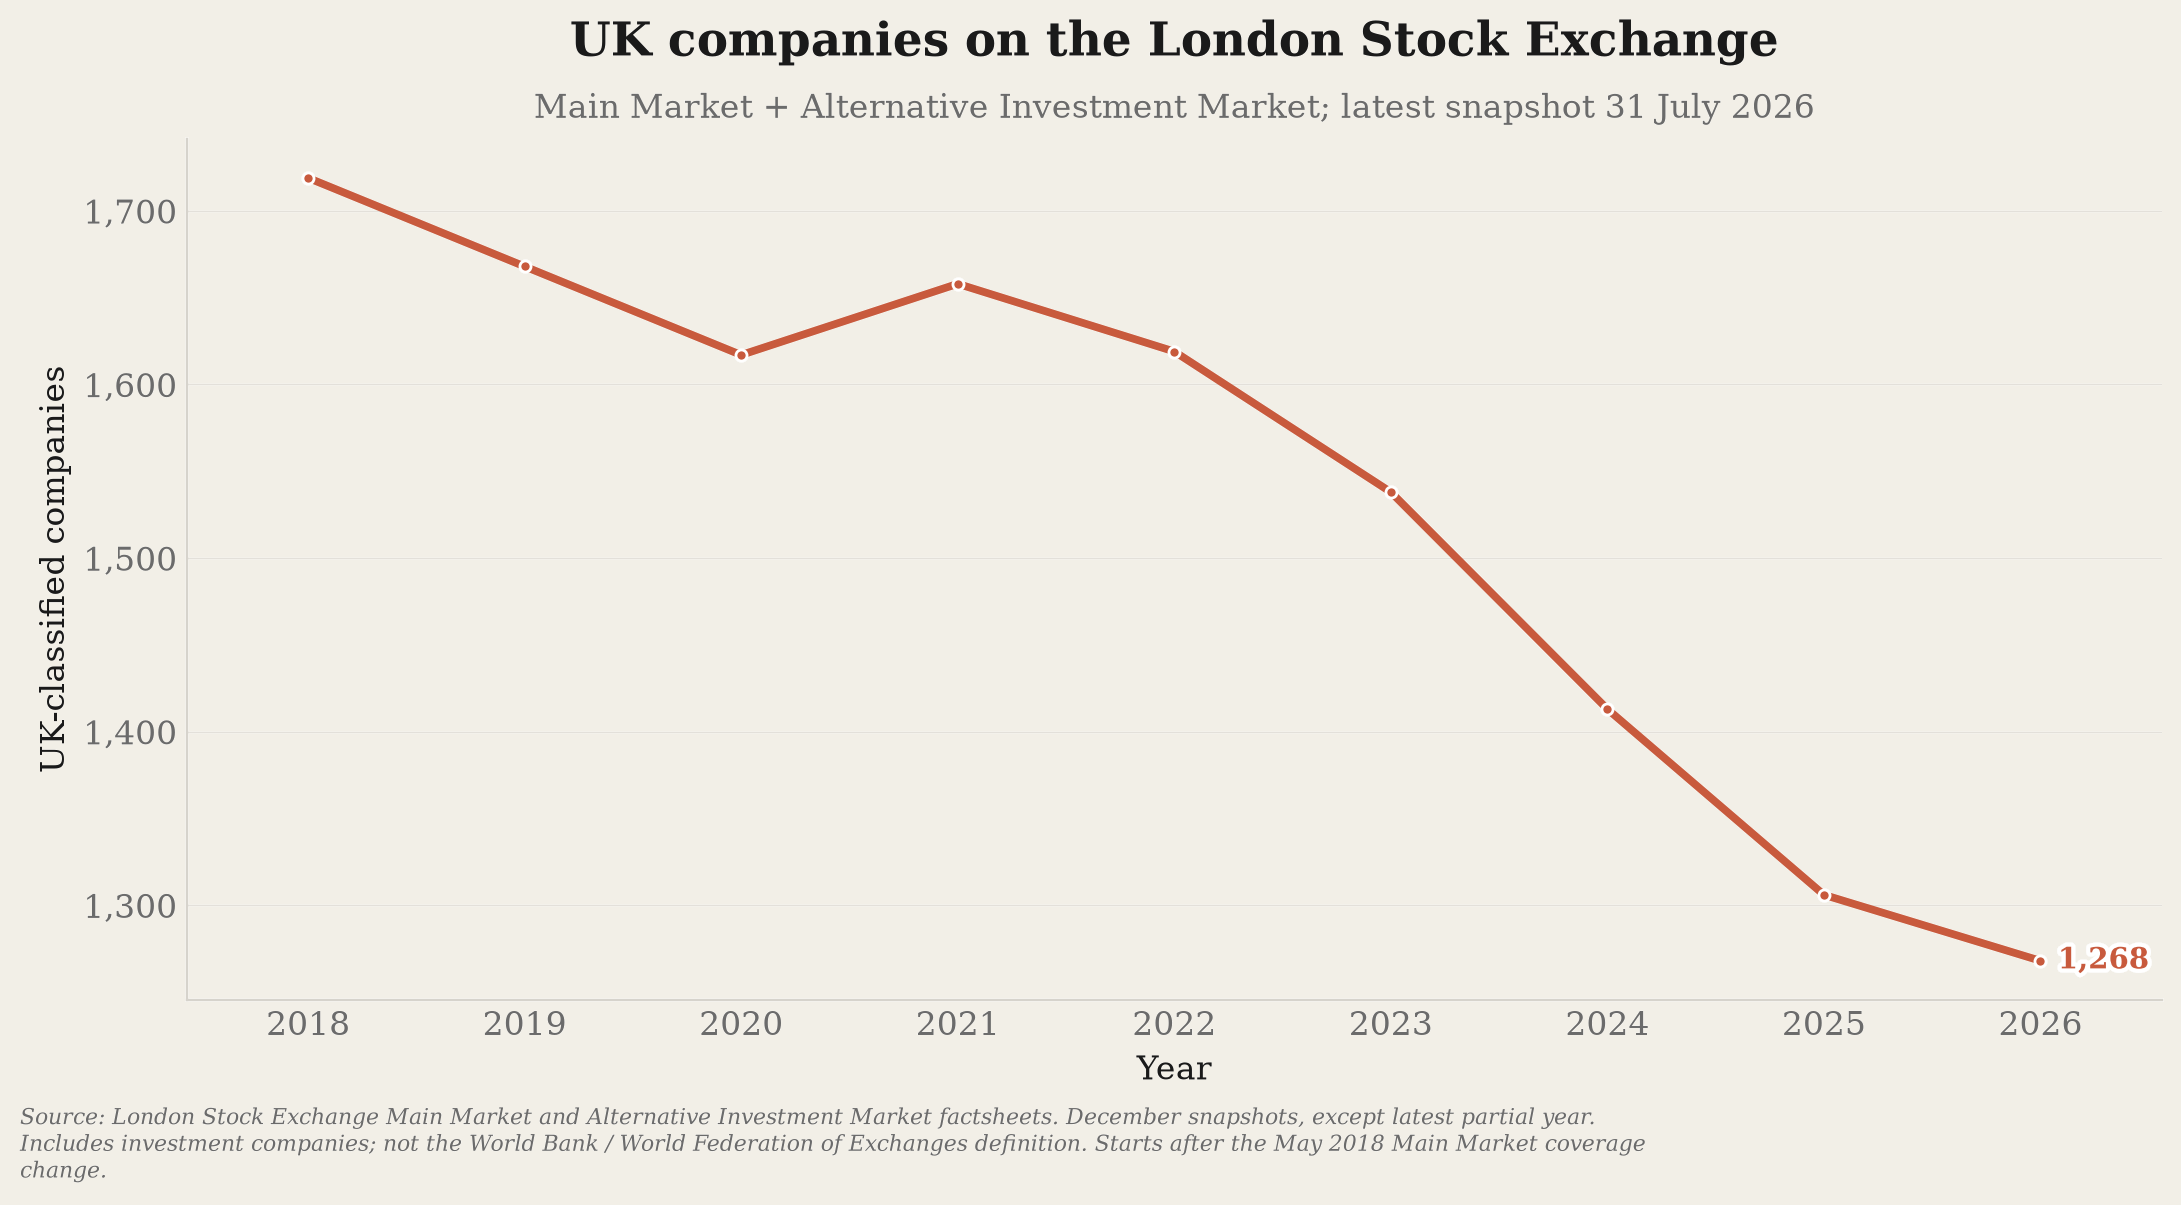
Company listings and market size, with London Stock Exchange and international definitions kept separate.
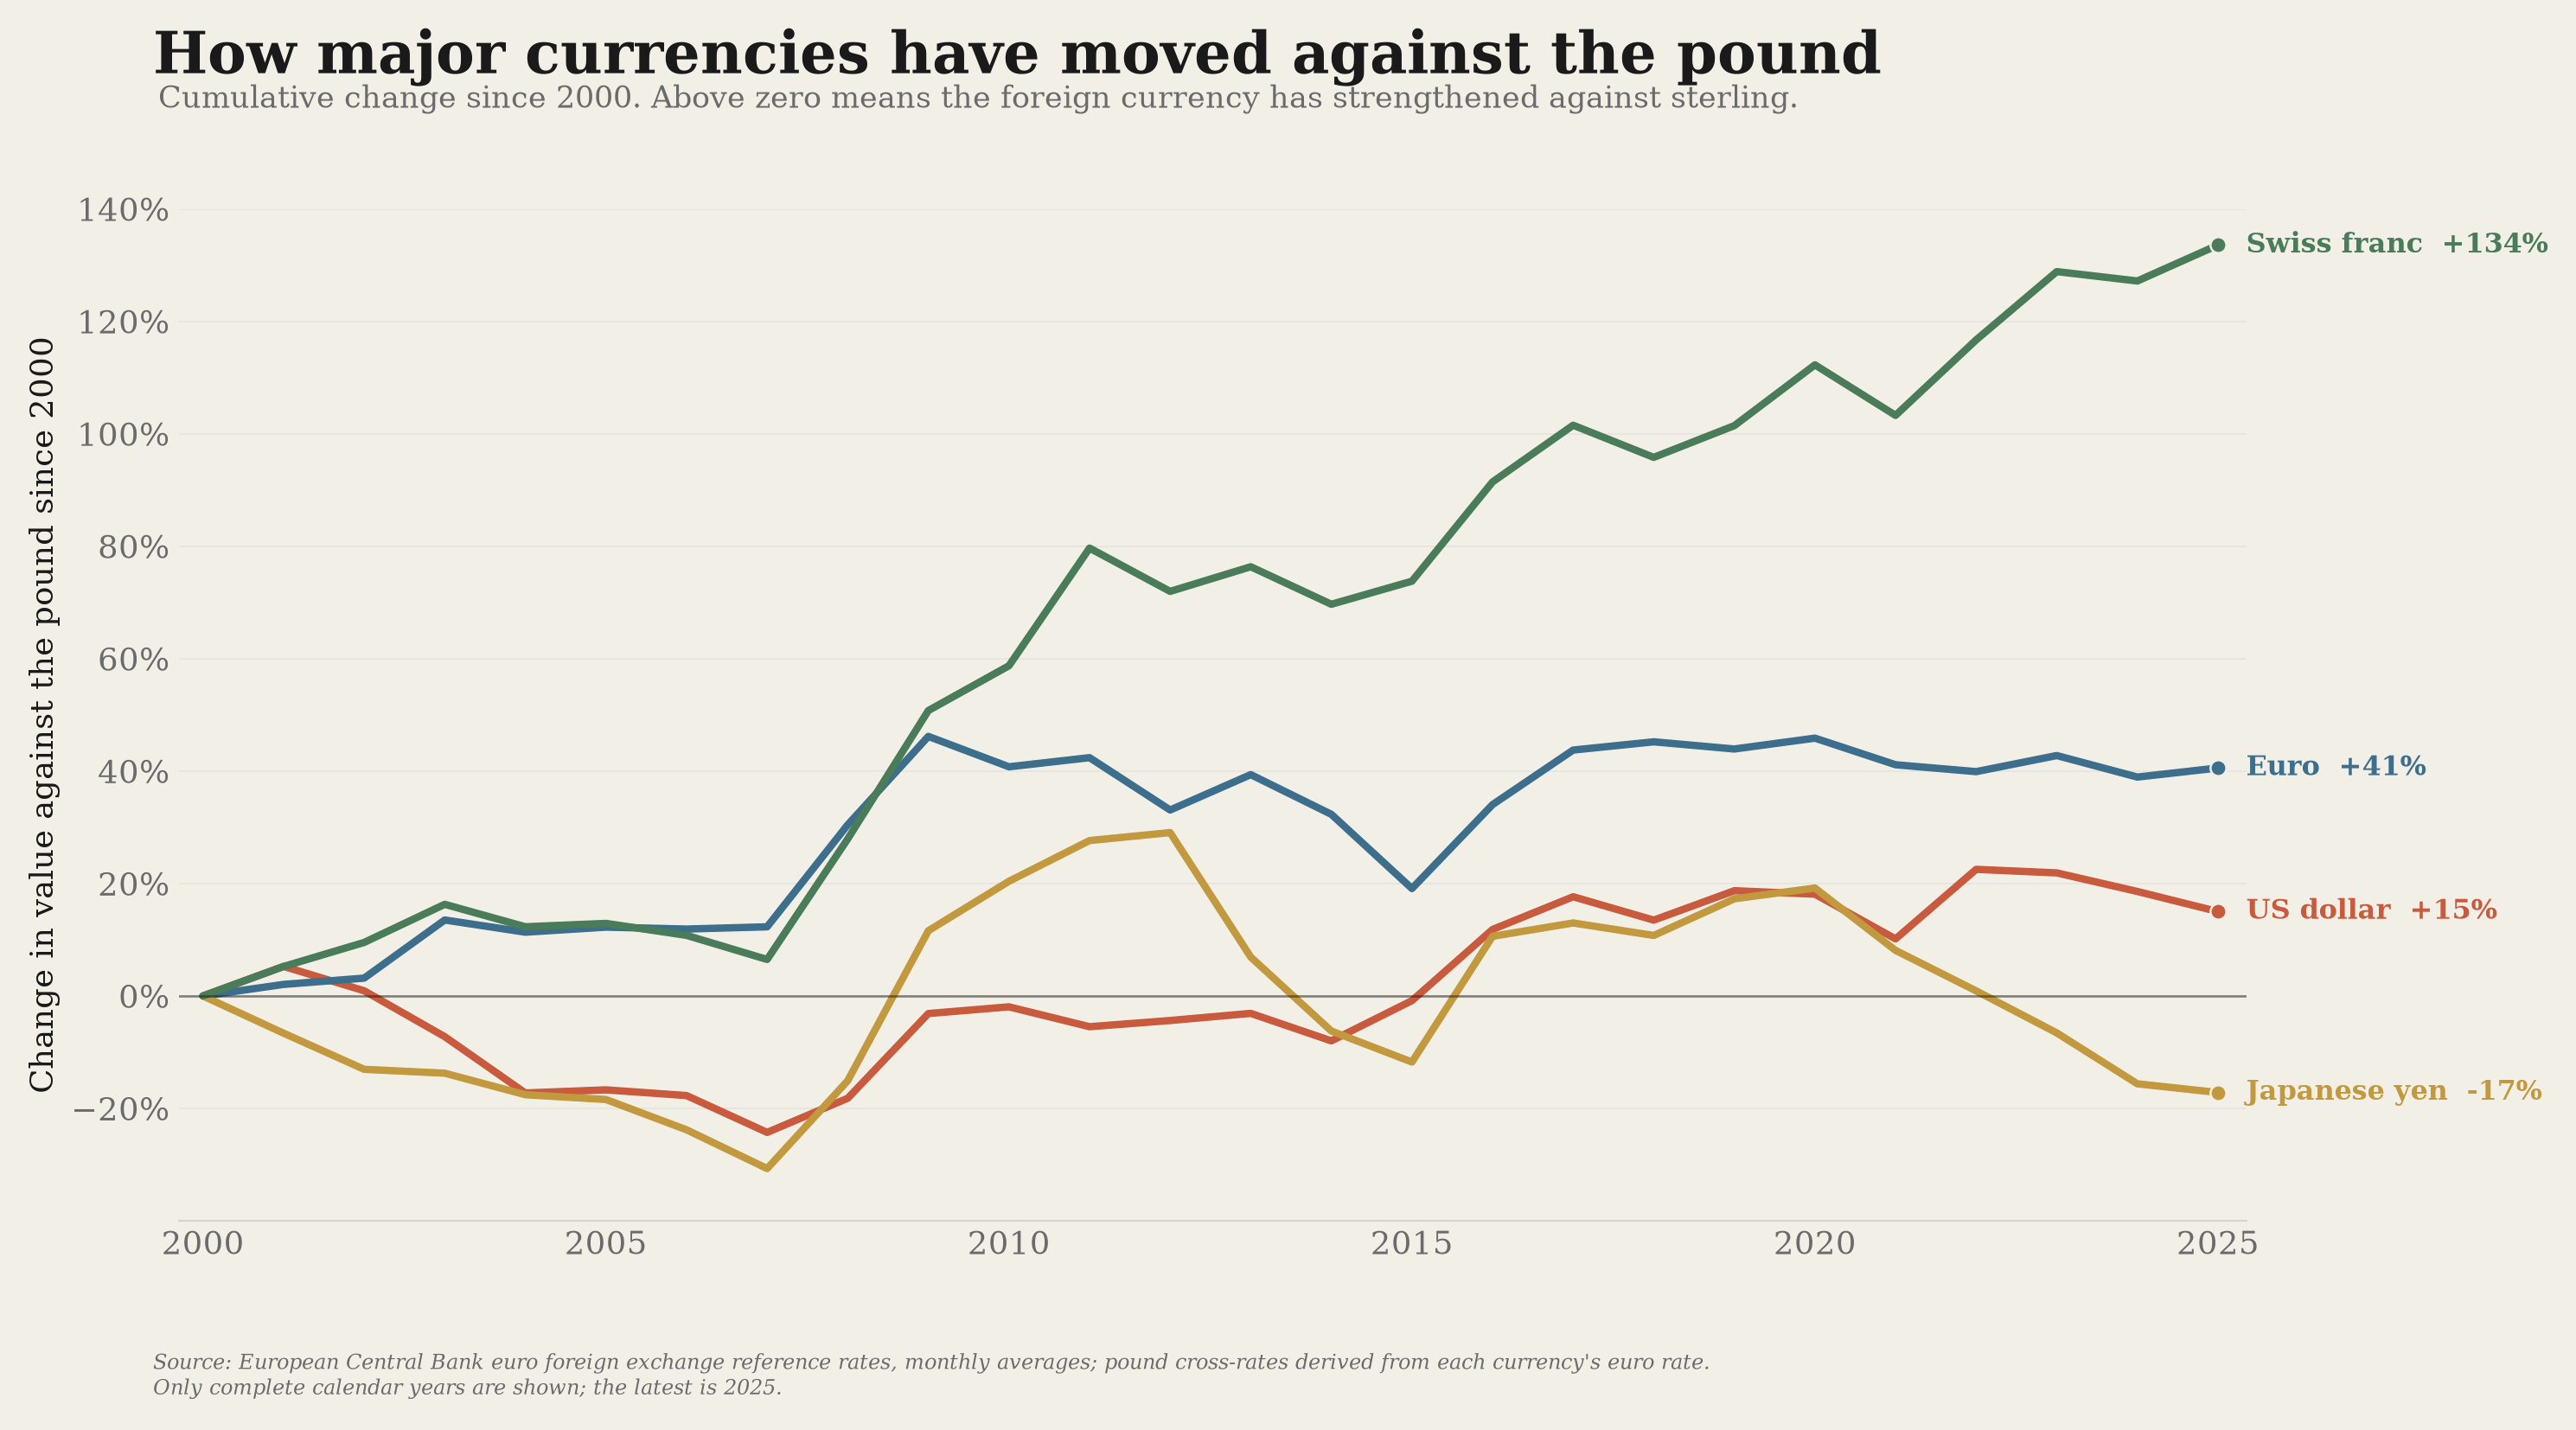
The pound against other currencies, using observed annual exchange rates.
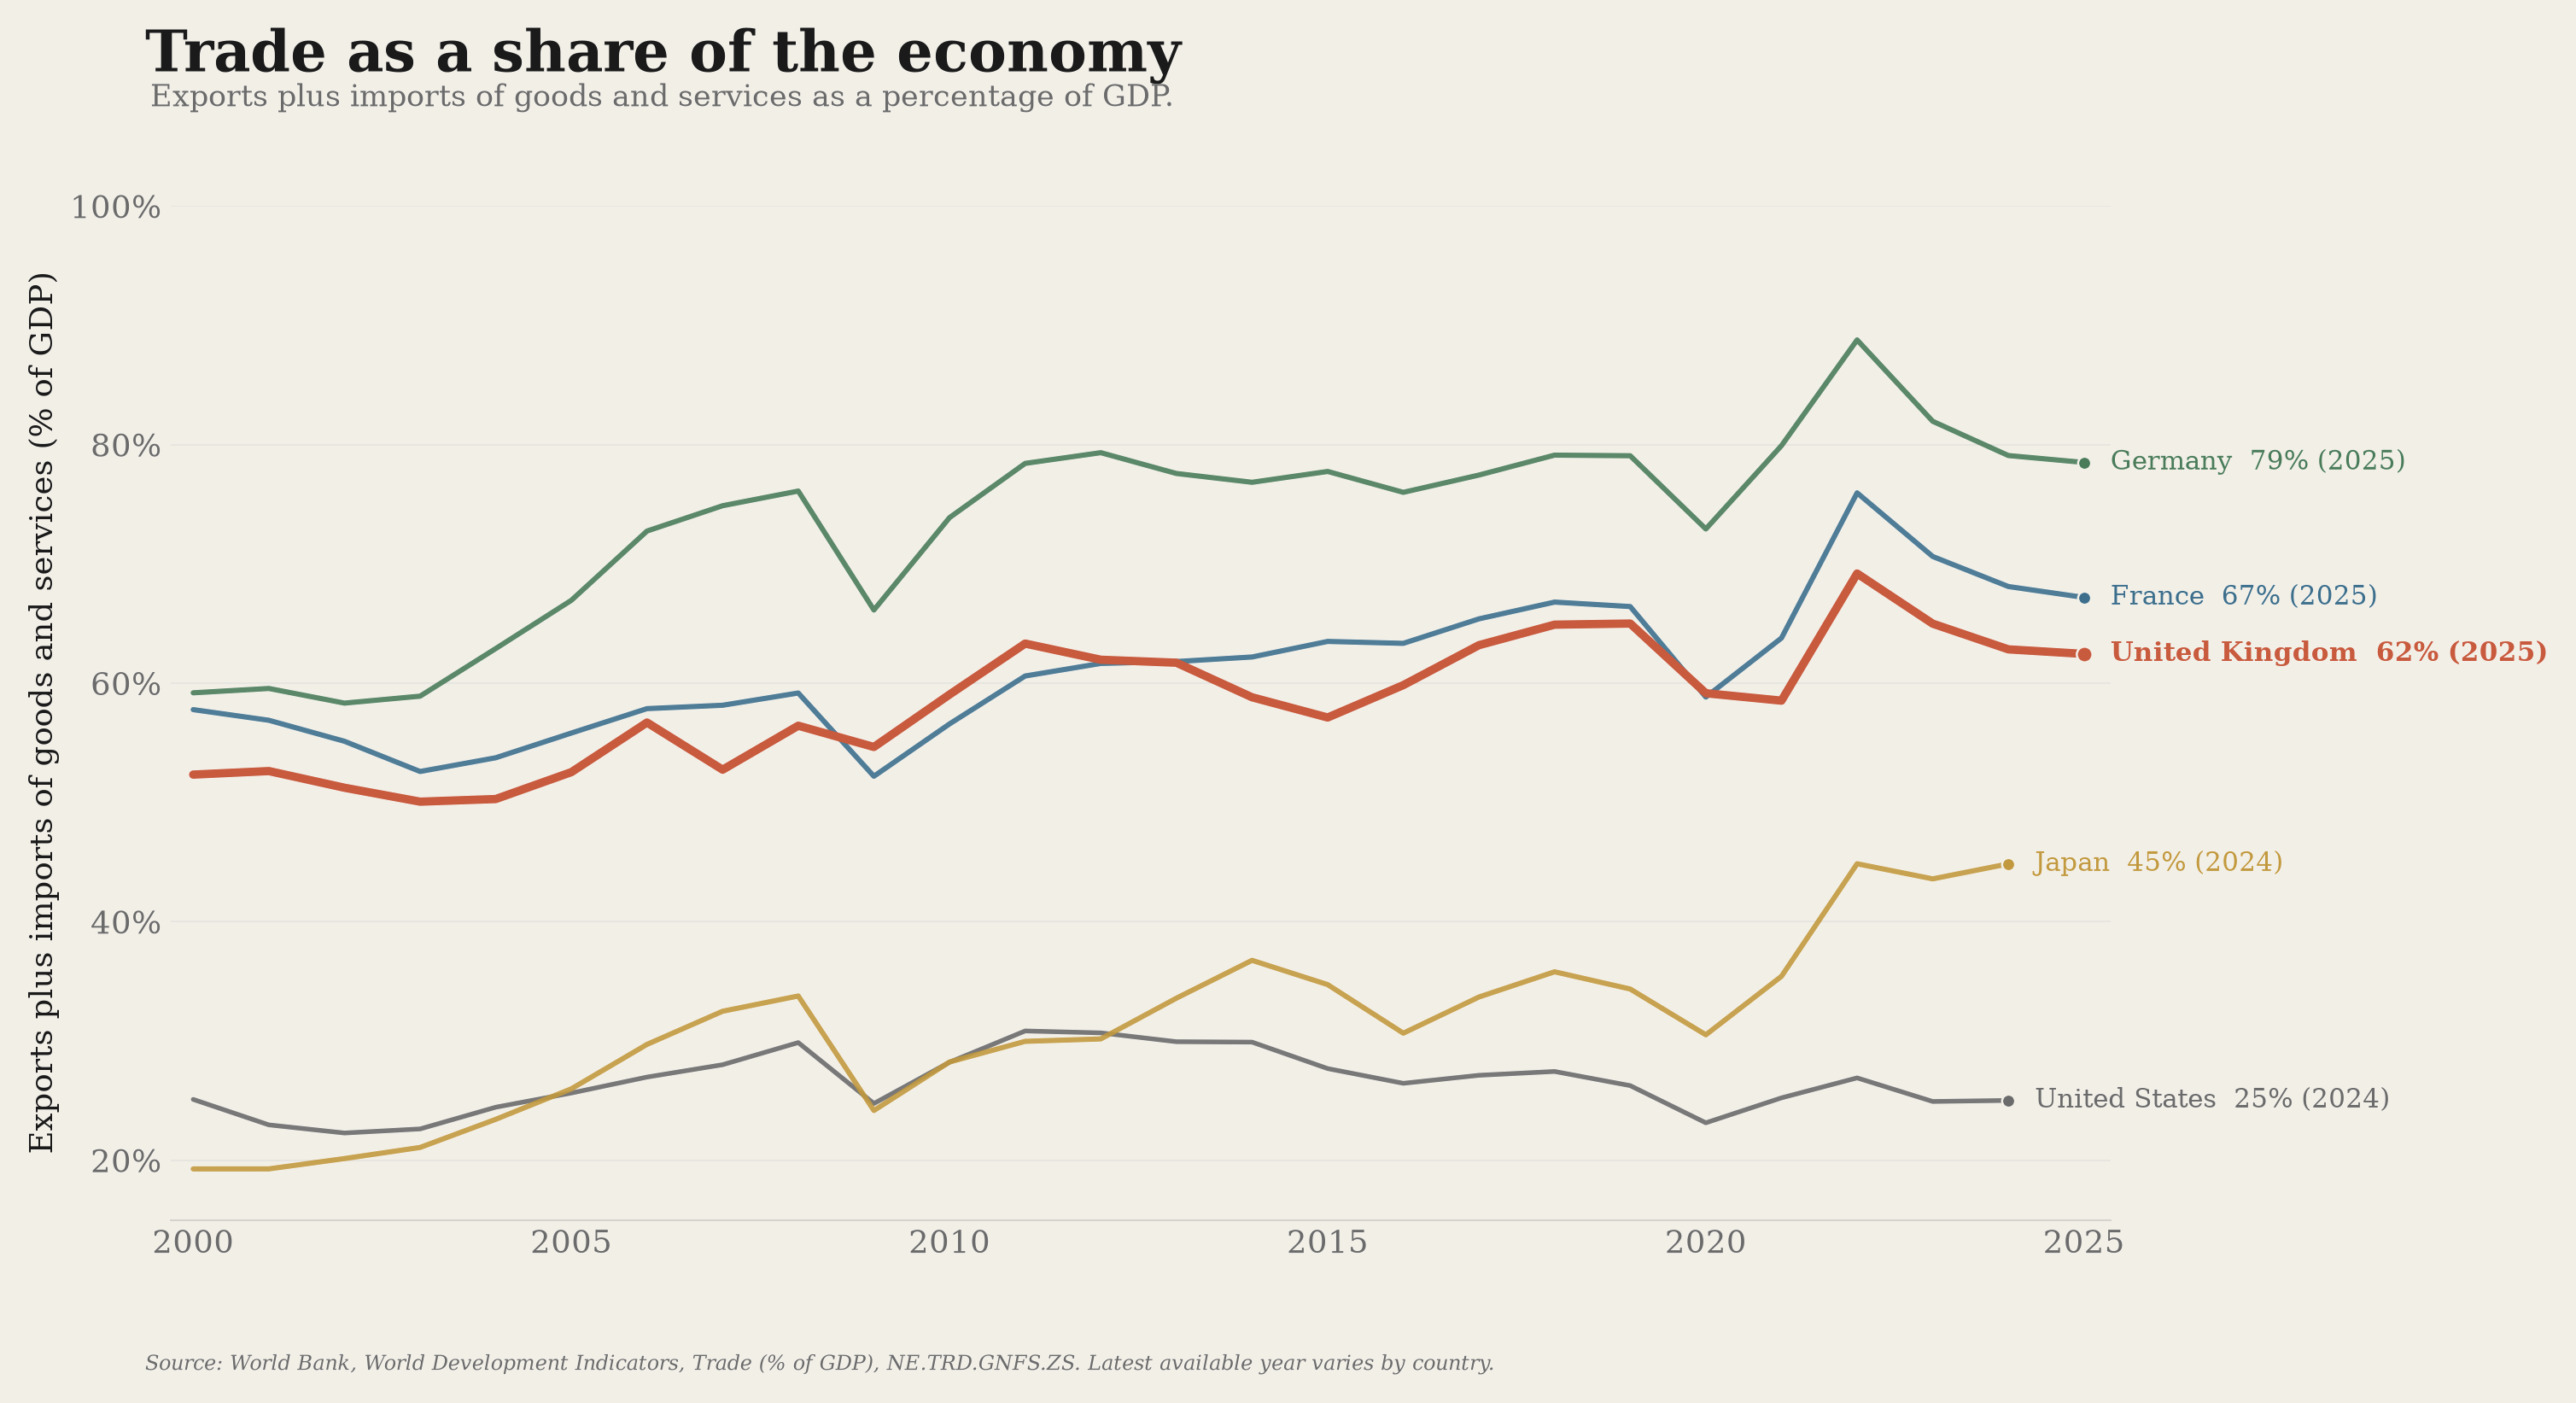
Imports and exports relative to the size of the economy.
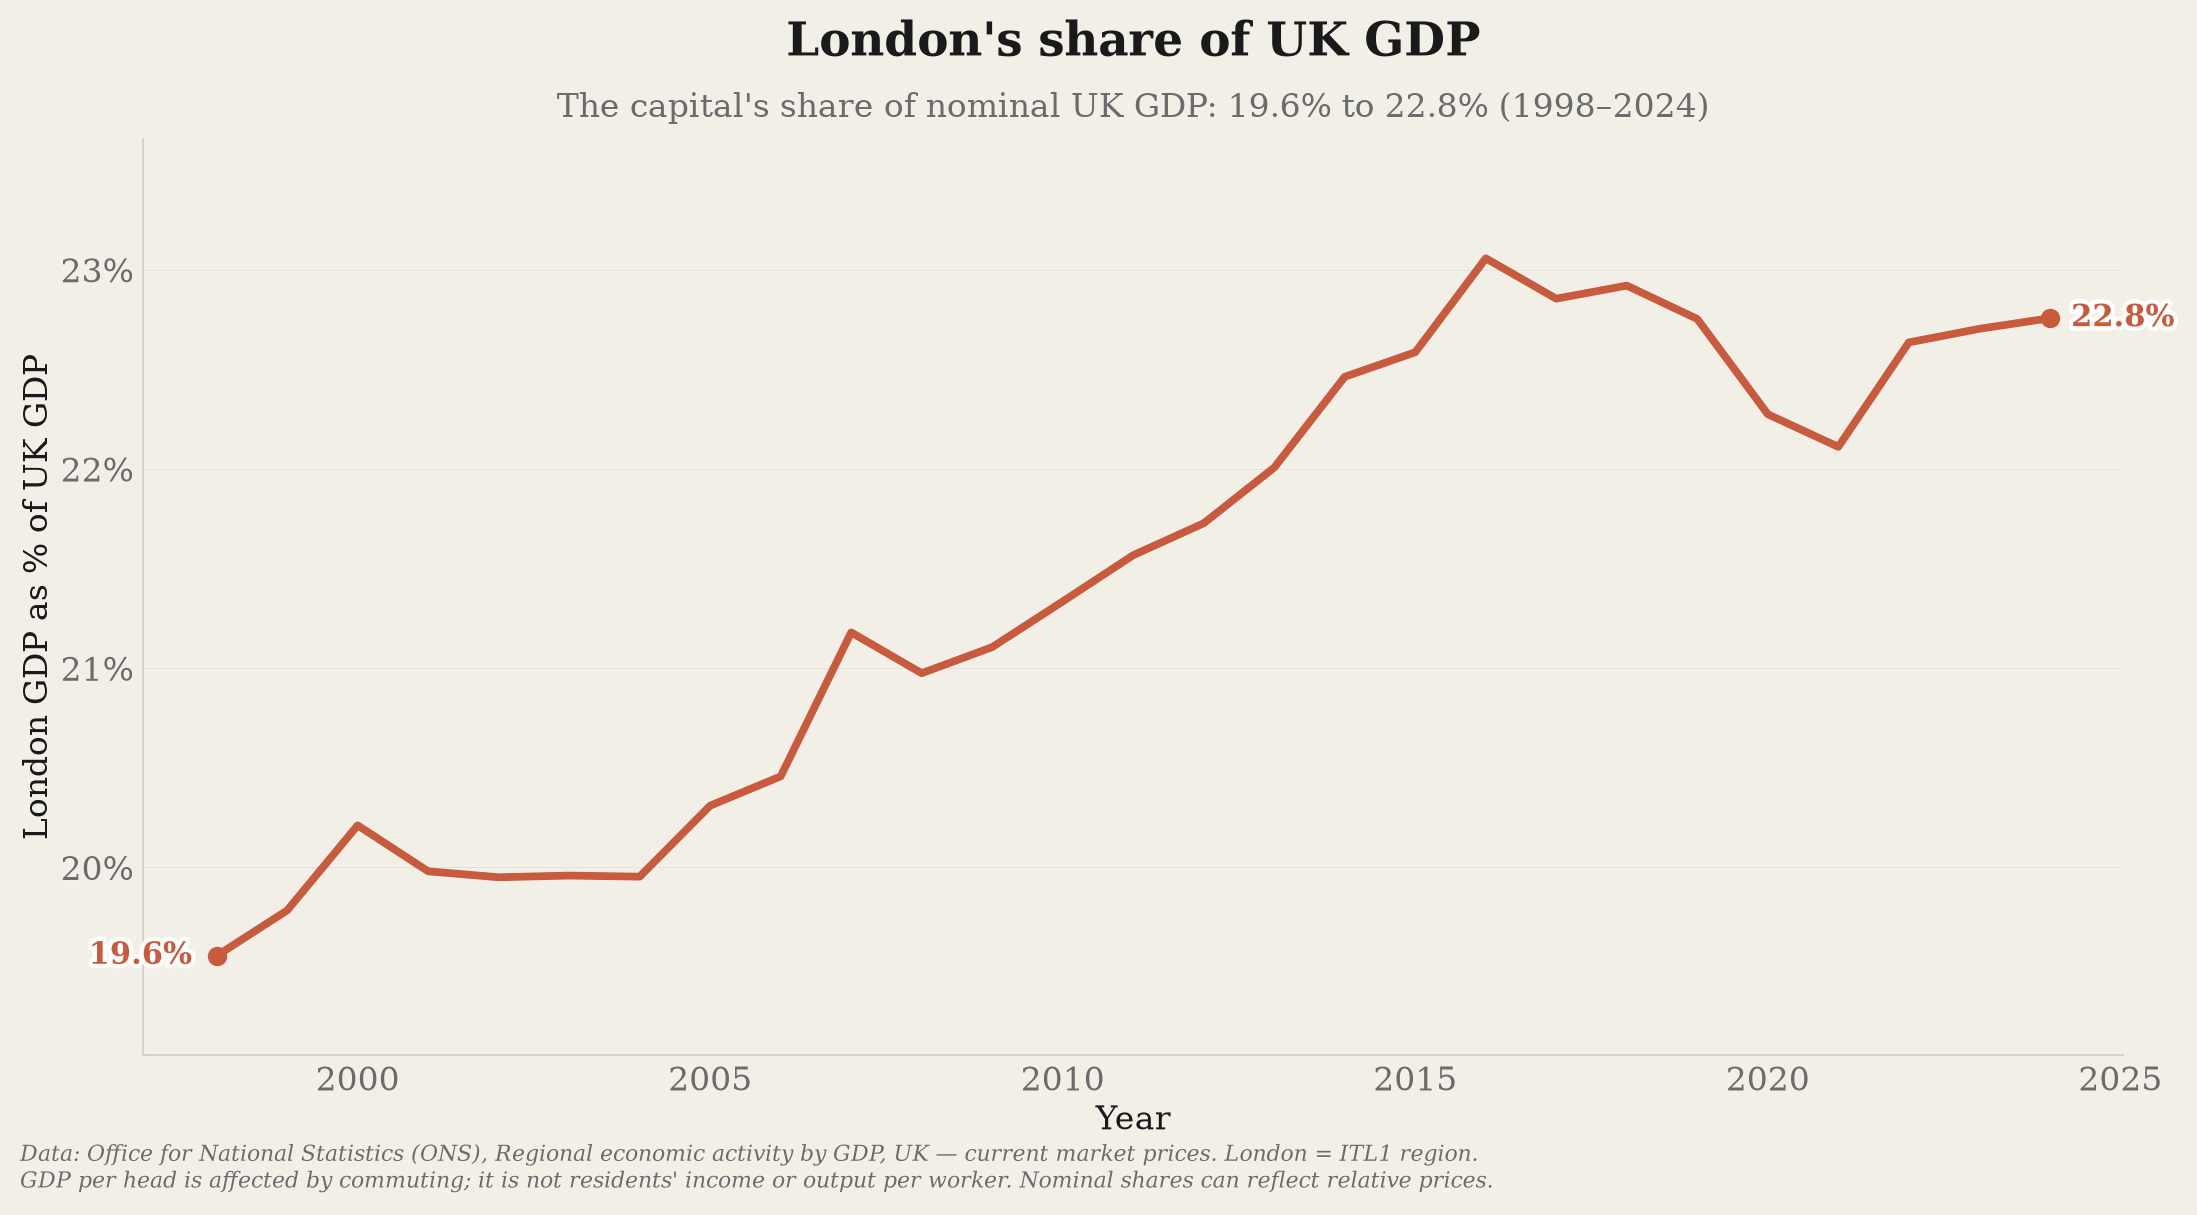
London's share of UK output and its GDP per head relative to the UK.
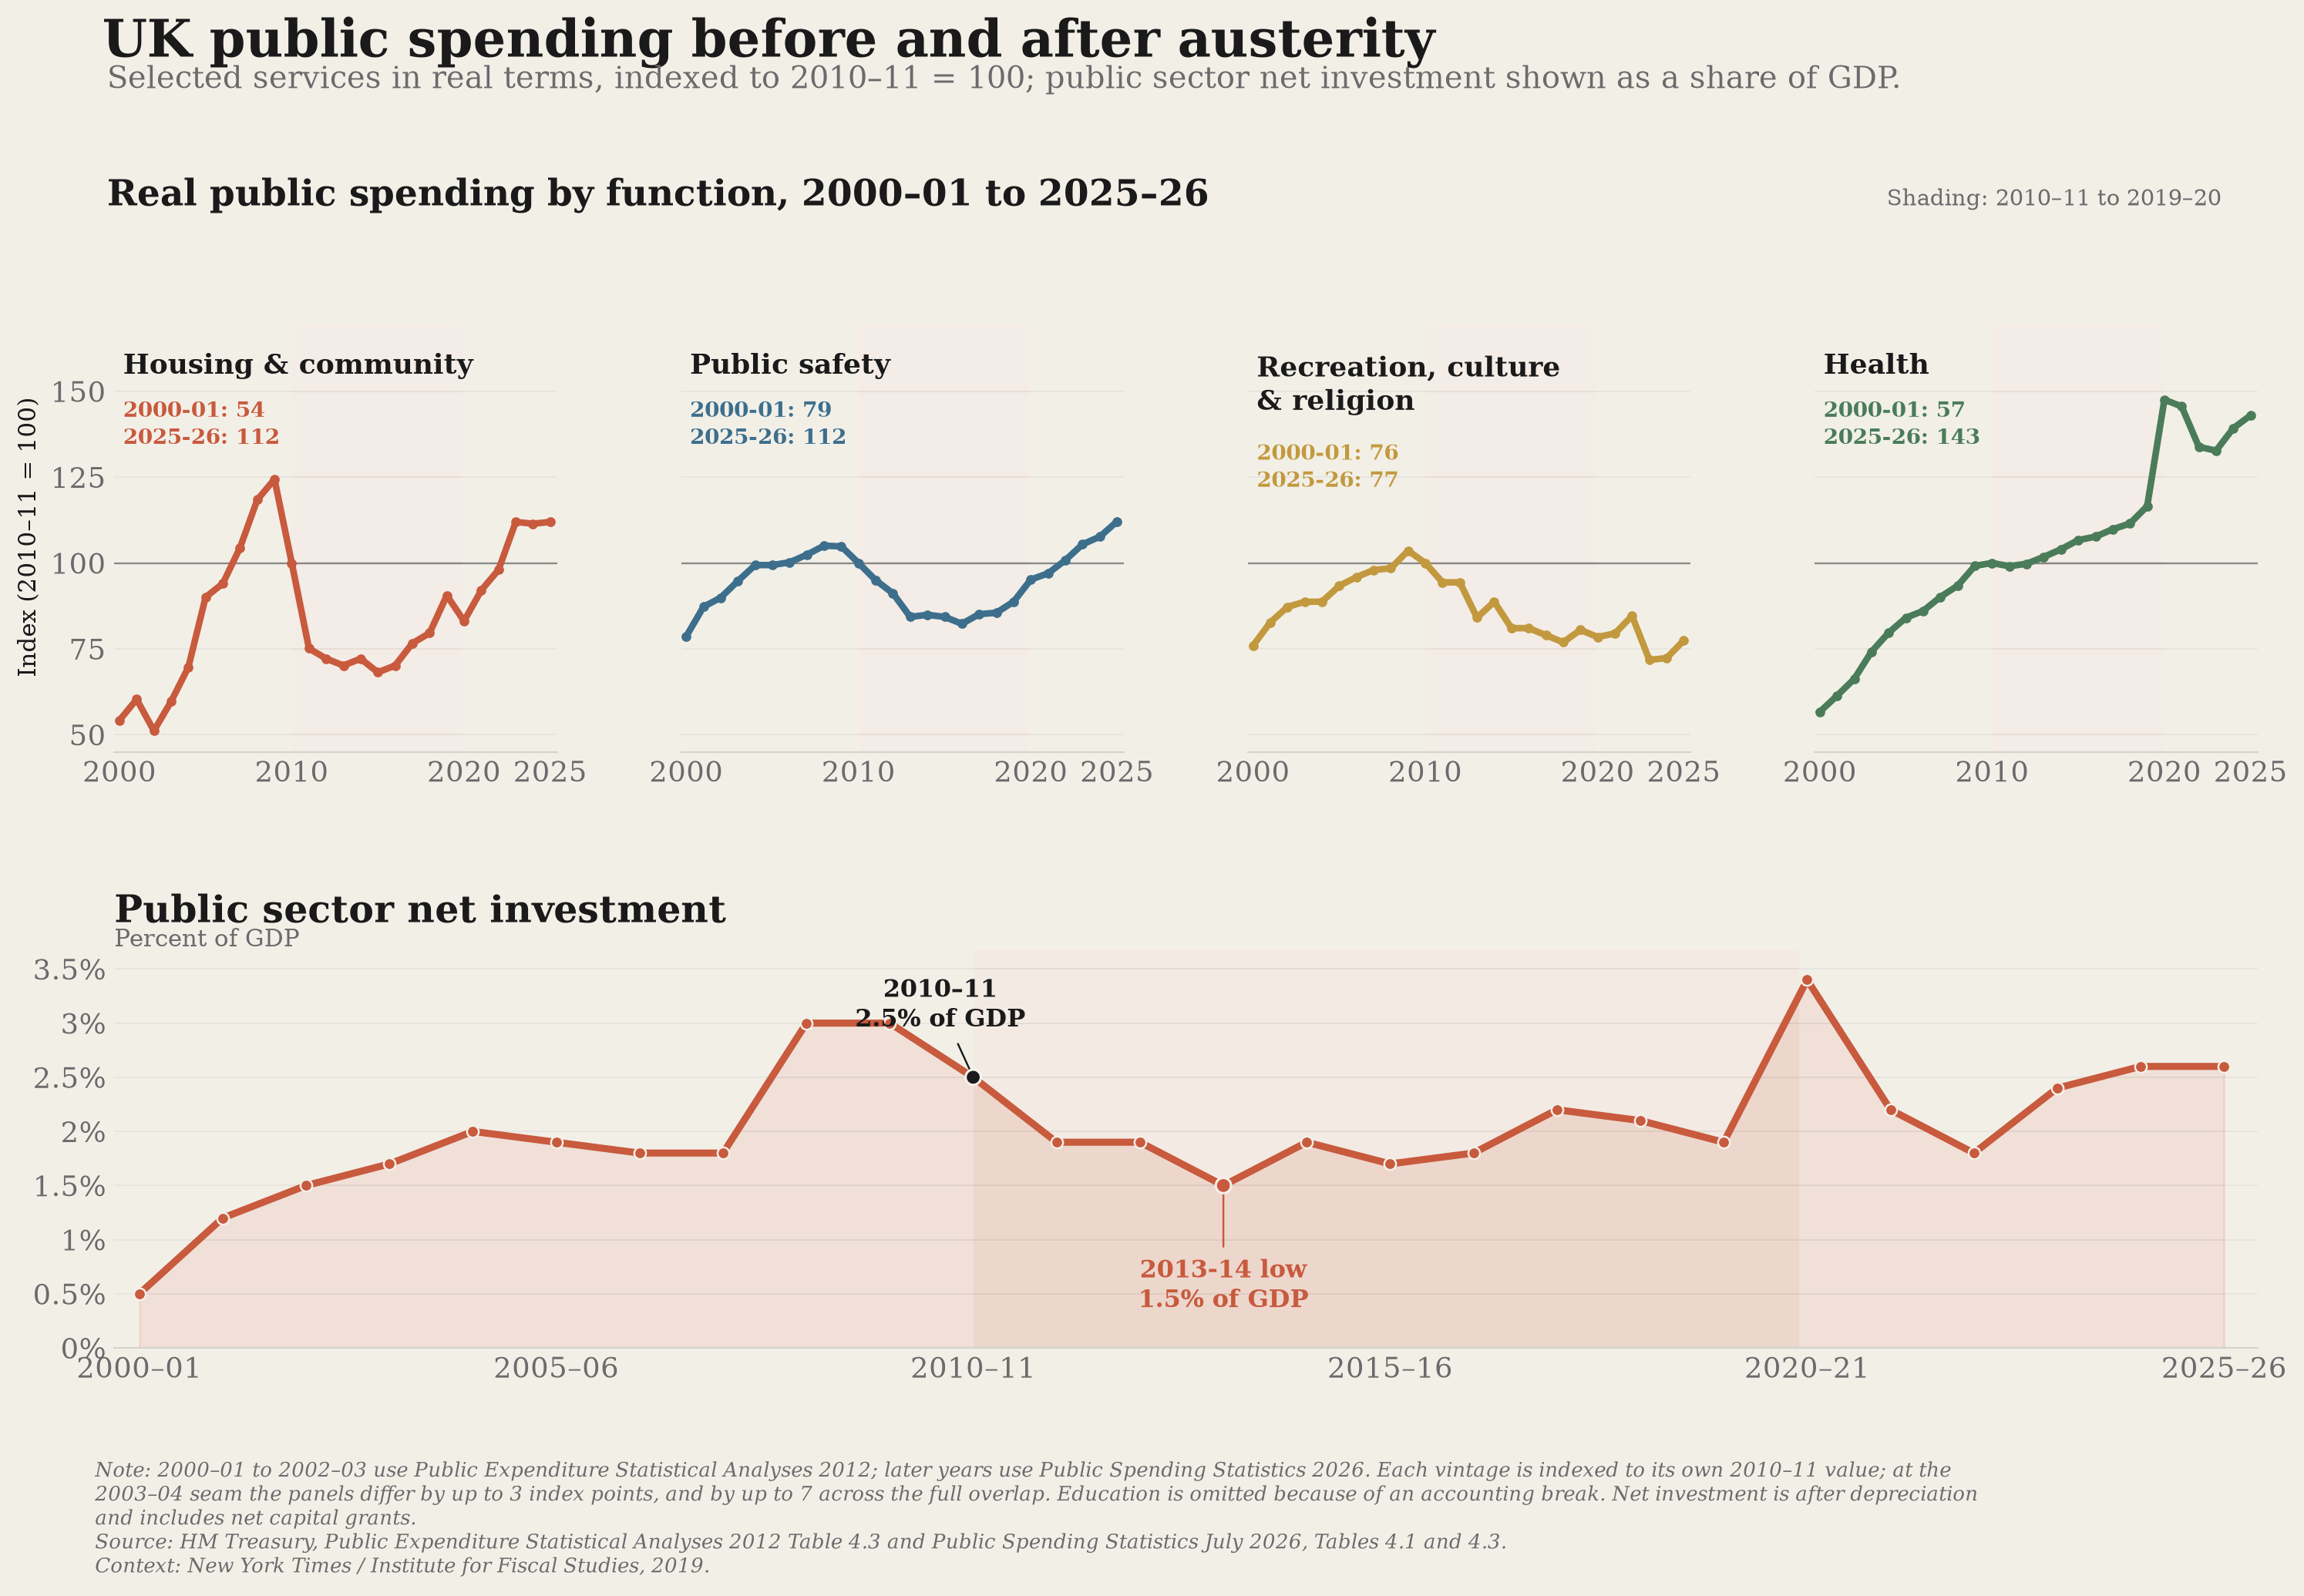
Public spending and investment, with financial years and inflation adjustments stated.
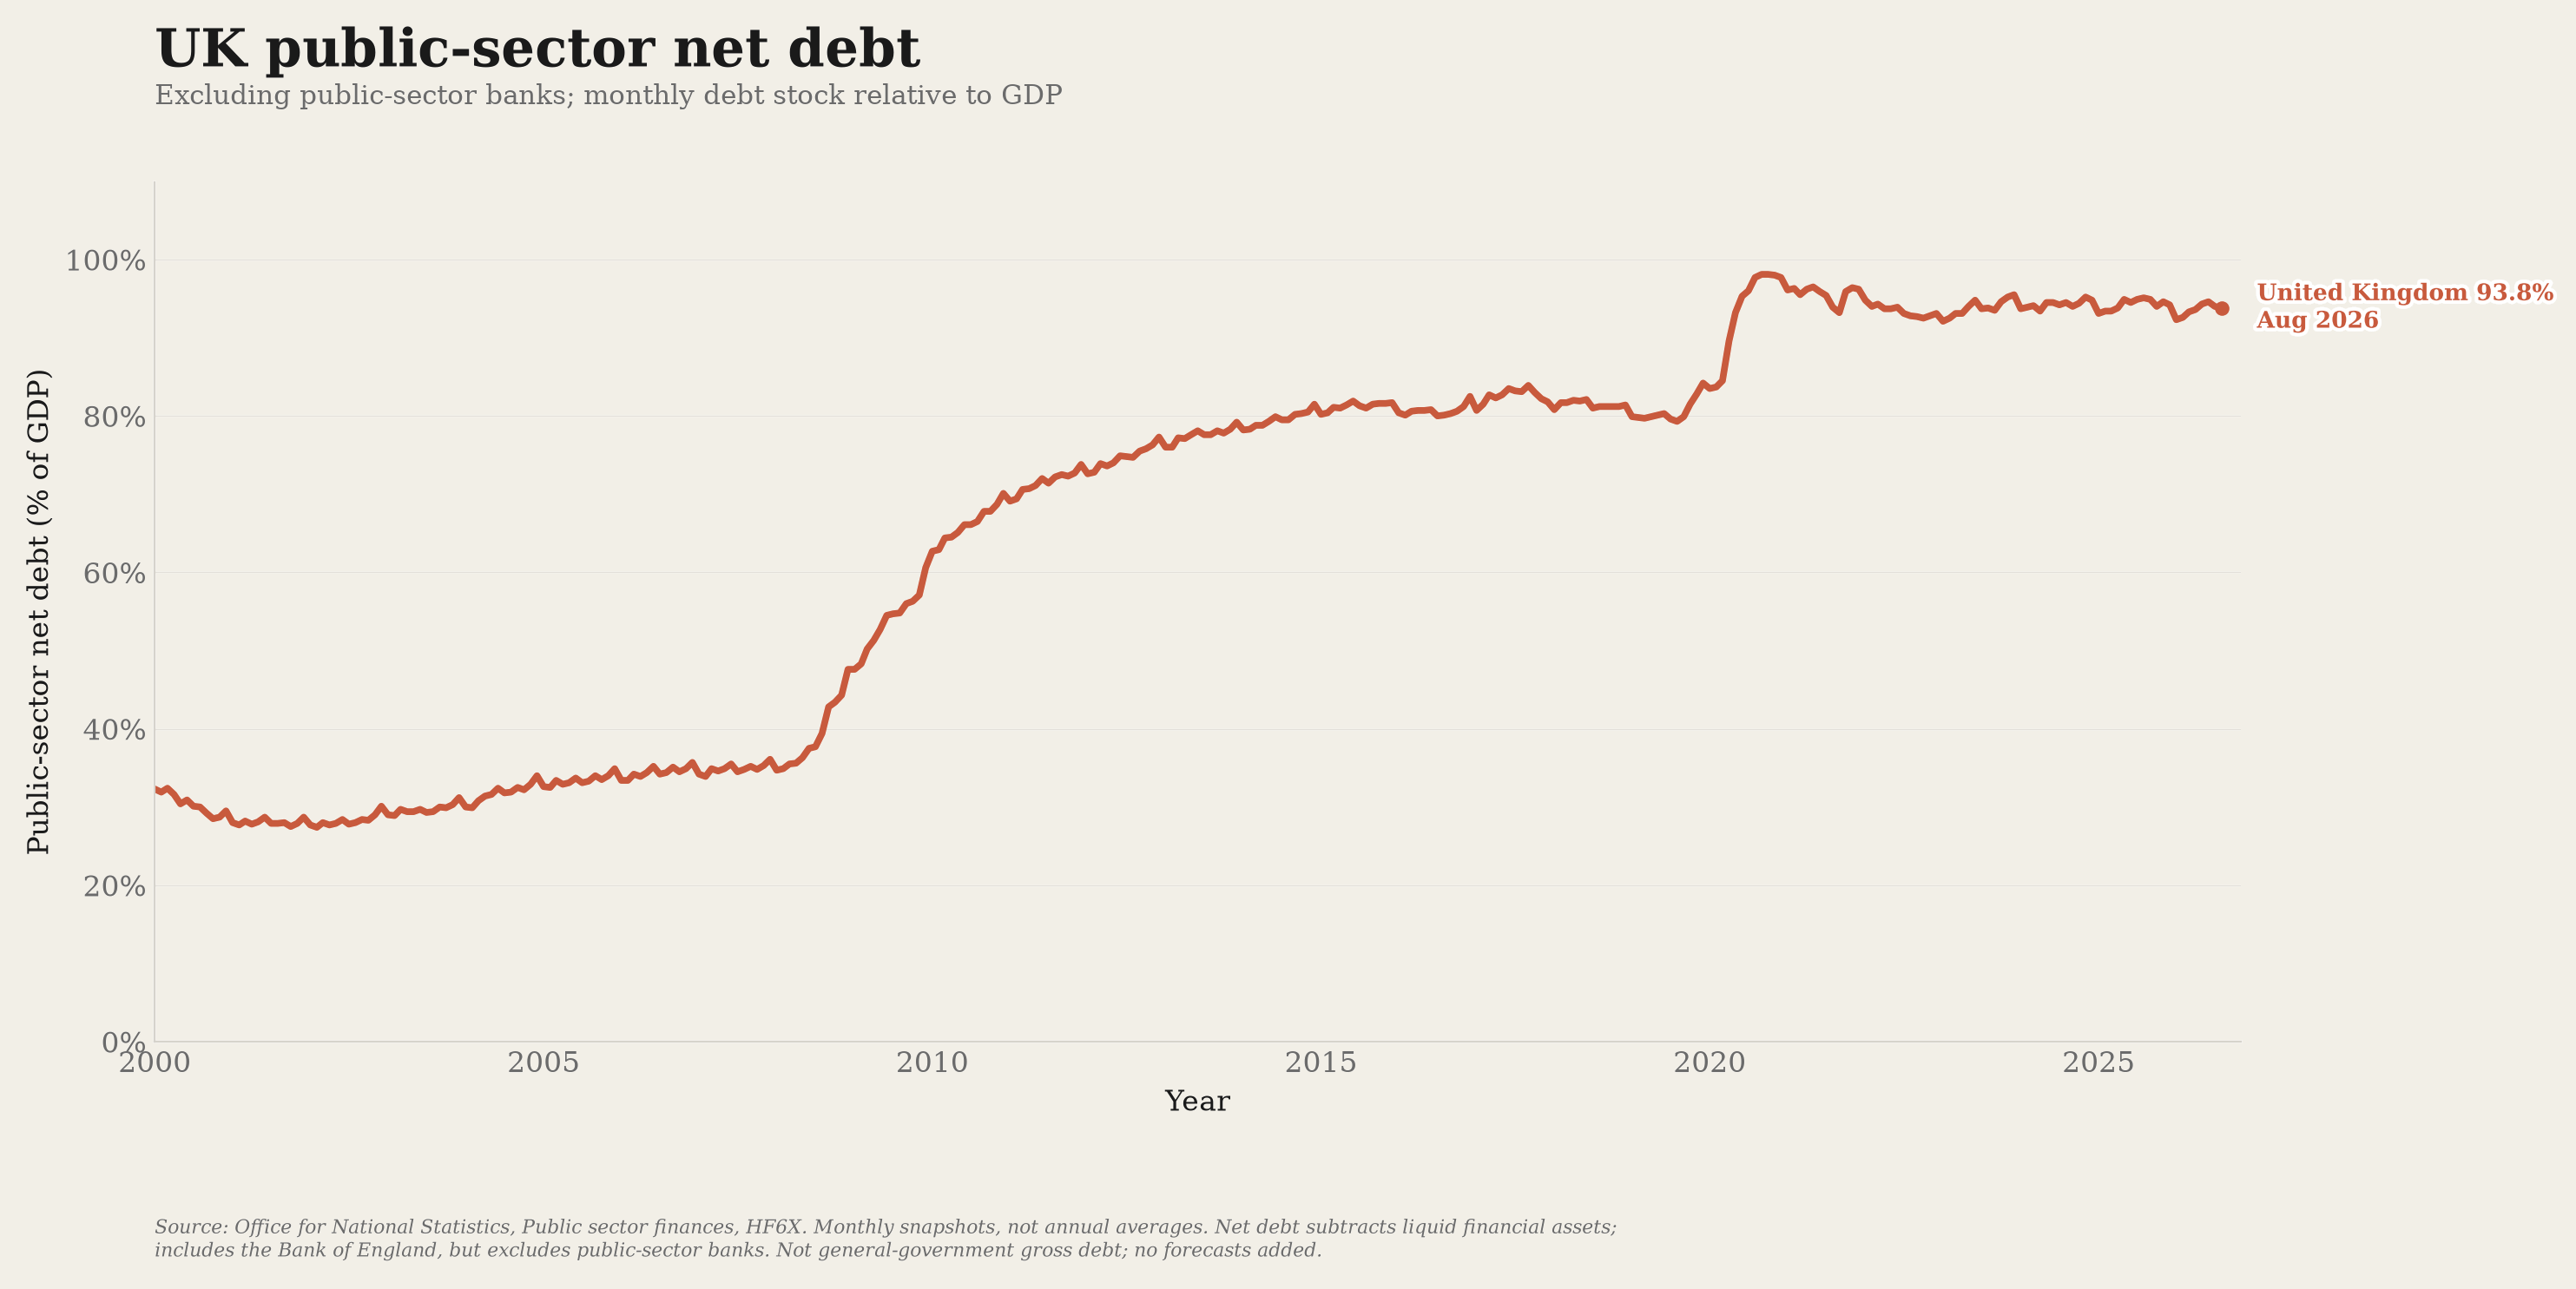
UK public debt relative to GDP and government-bond yields: the debt stock and the cost of new borrowing.
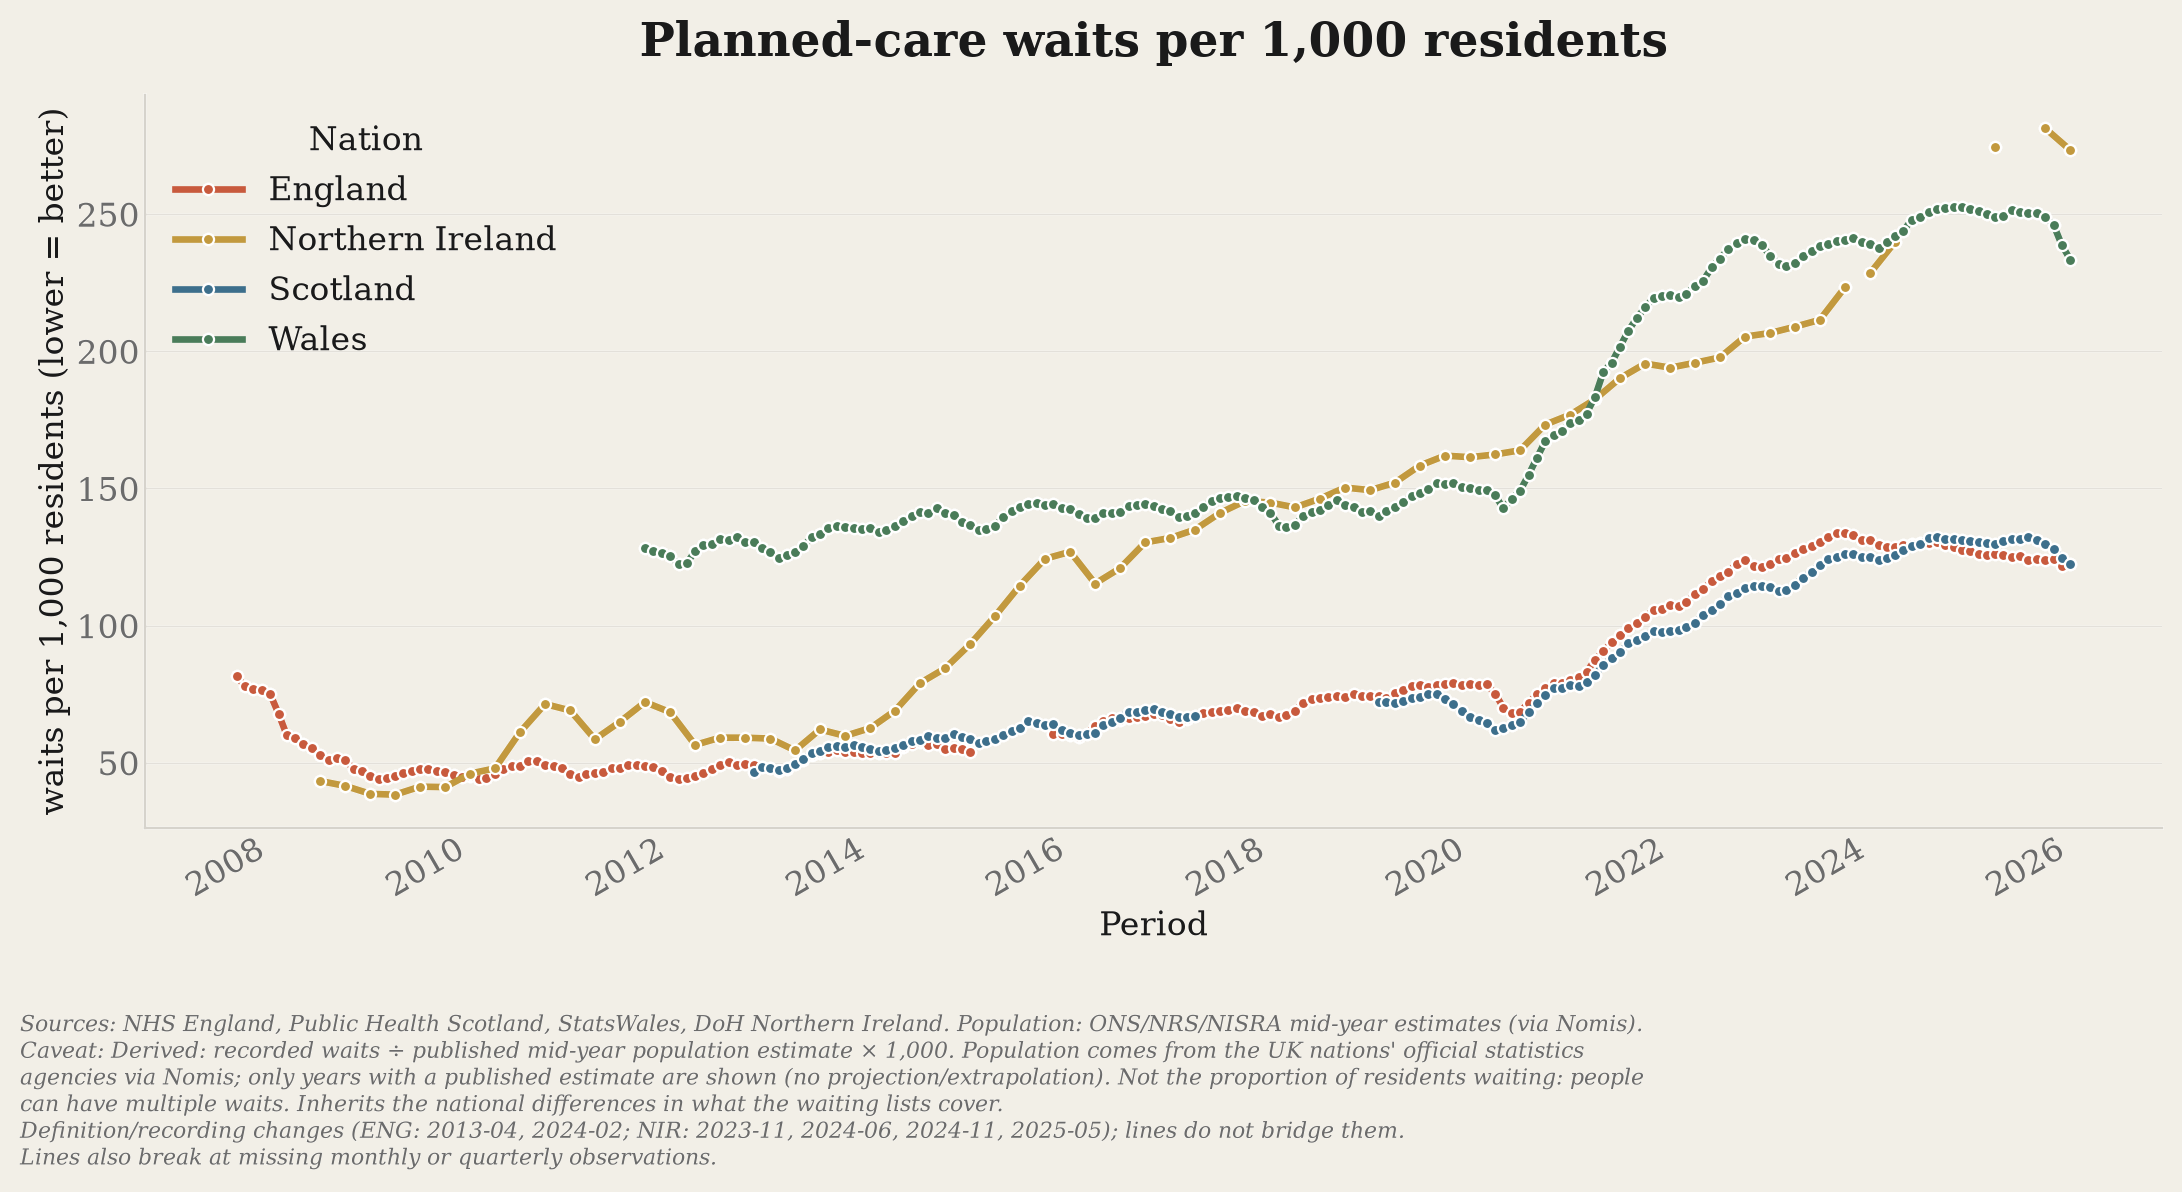
Waiting lists and treatment standards across the four nations, with scope breaks.
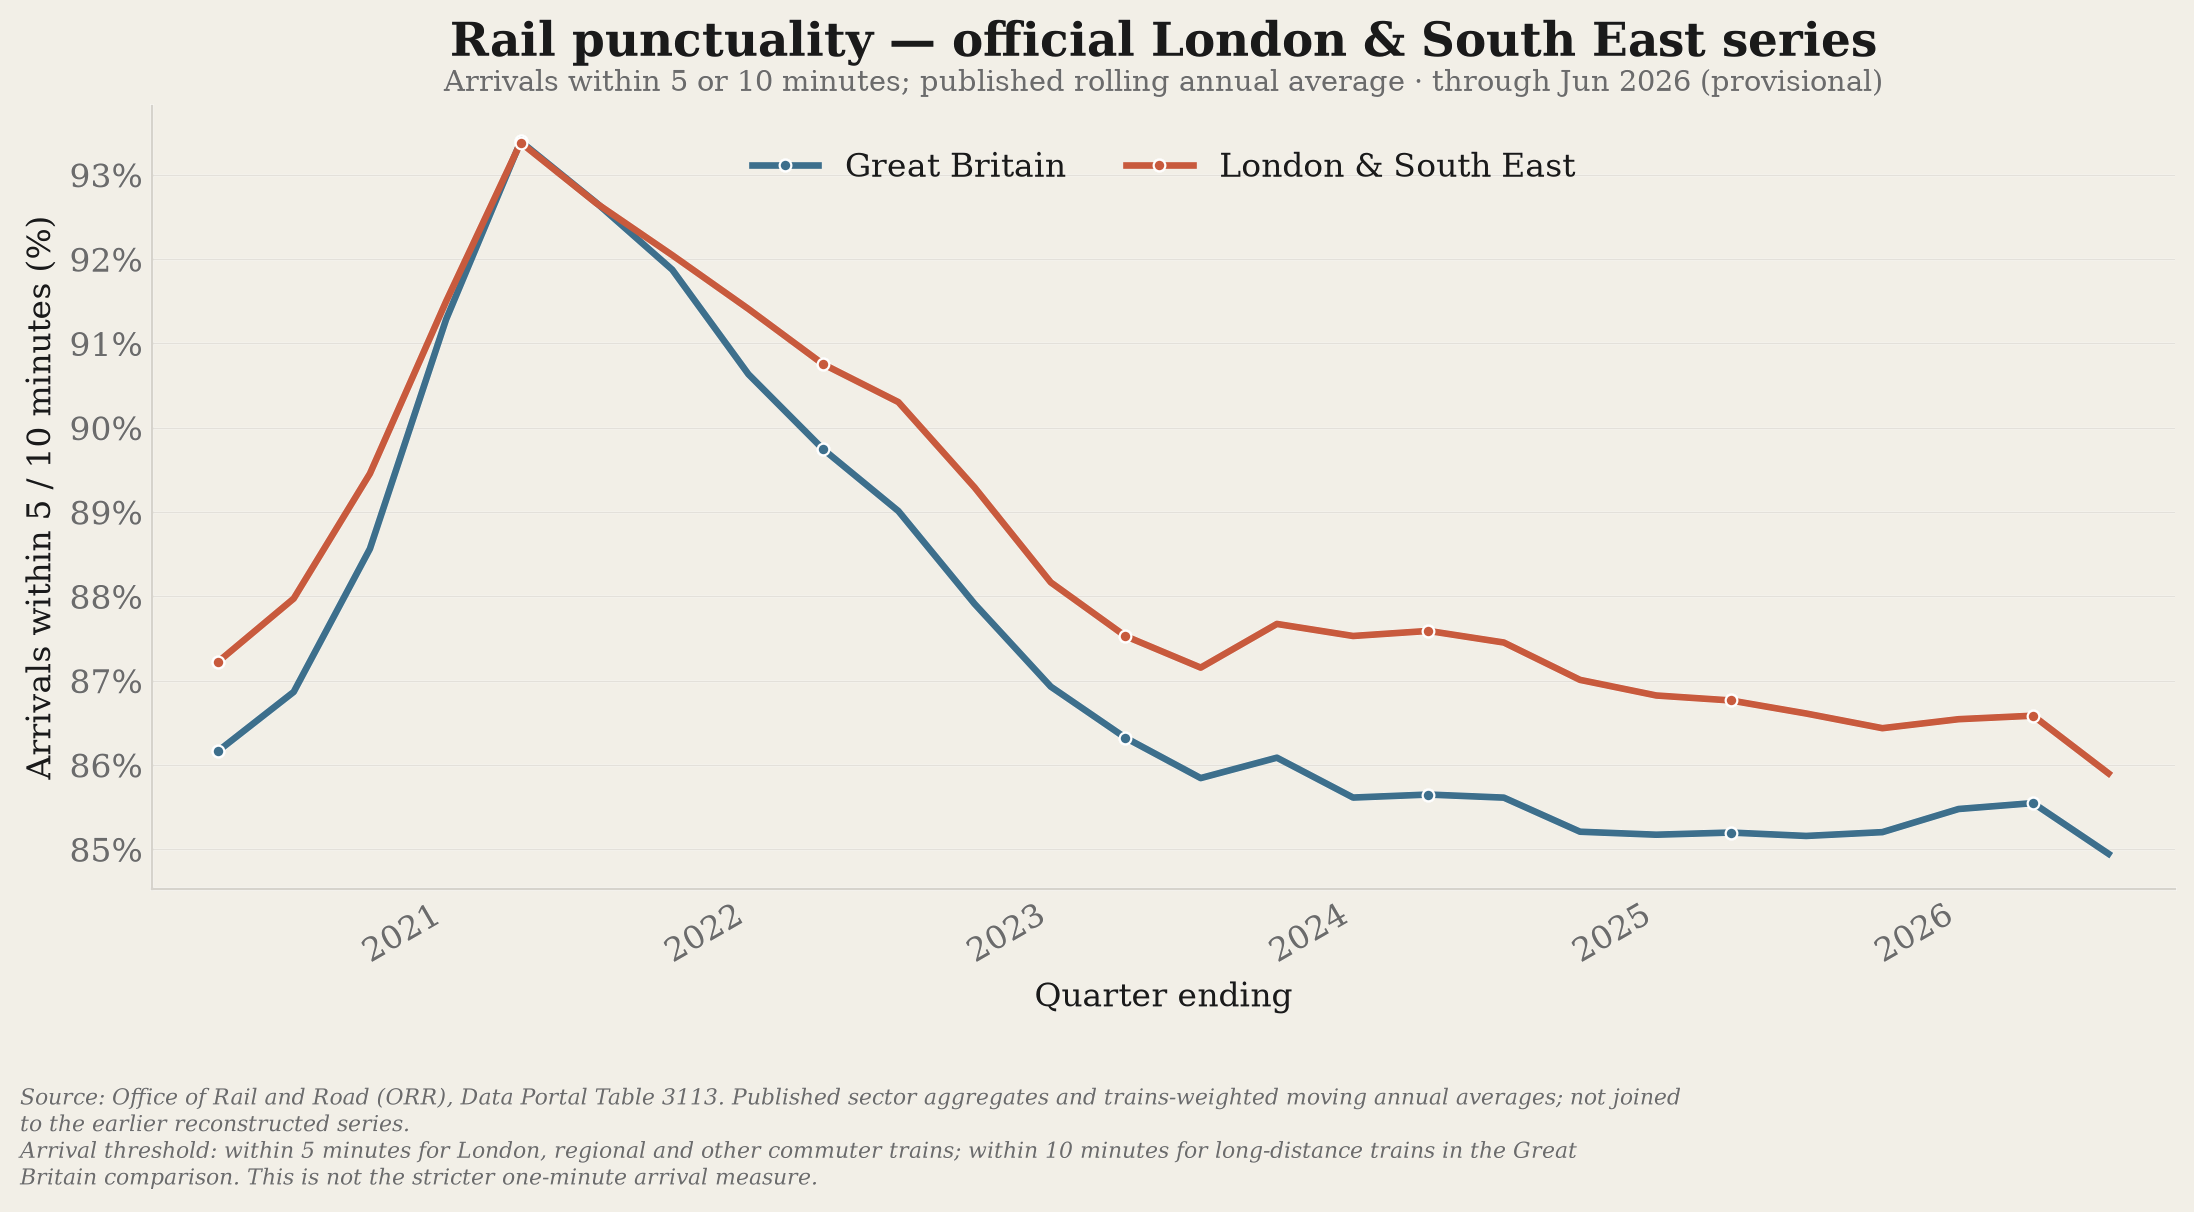
Official punctuality and cancellation measures, distinct from historical reconstruction.
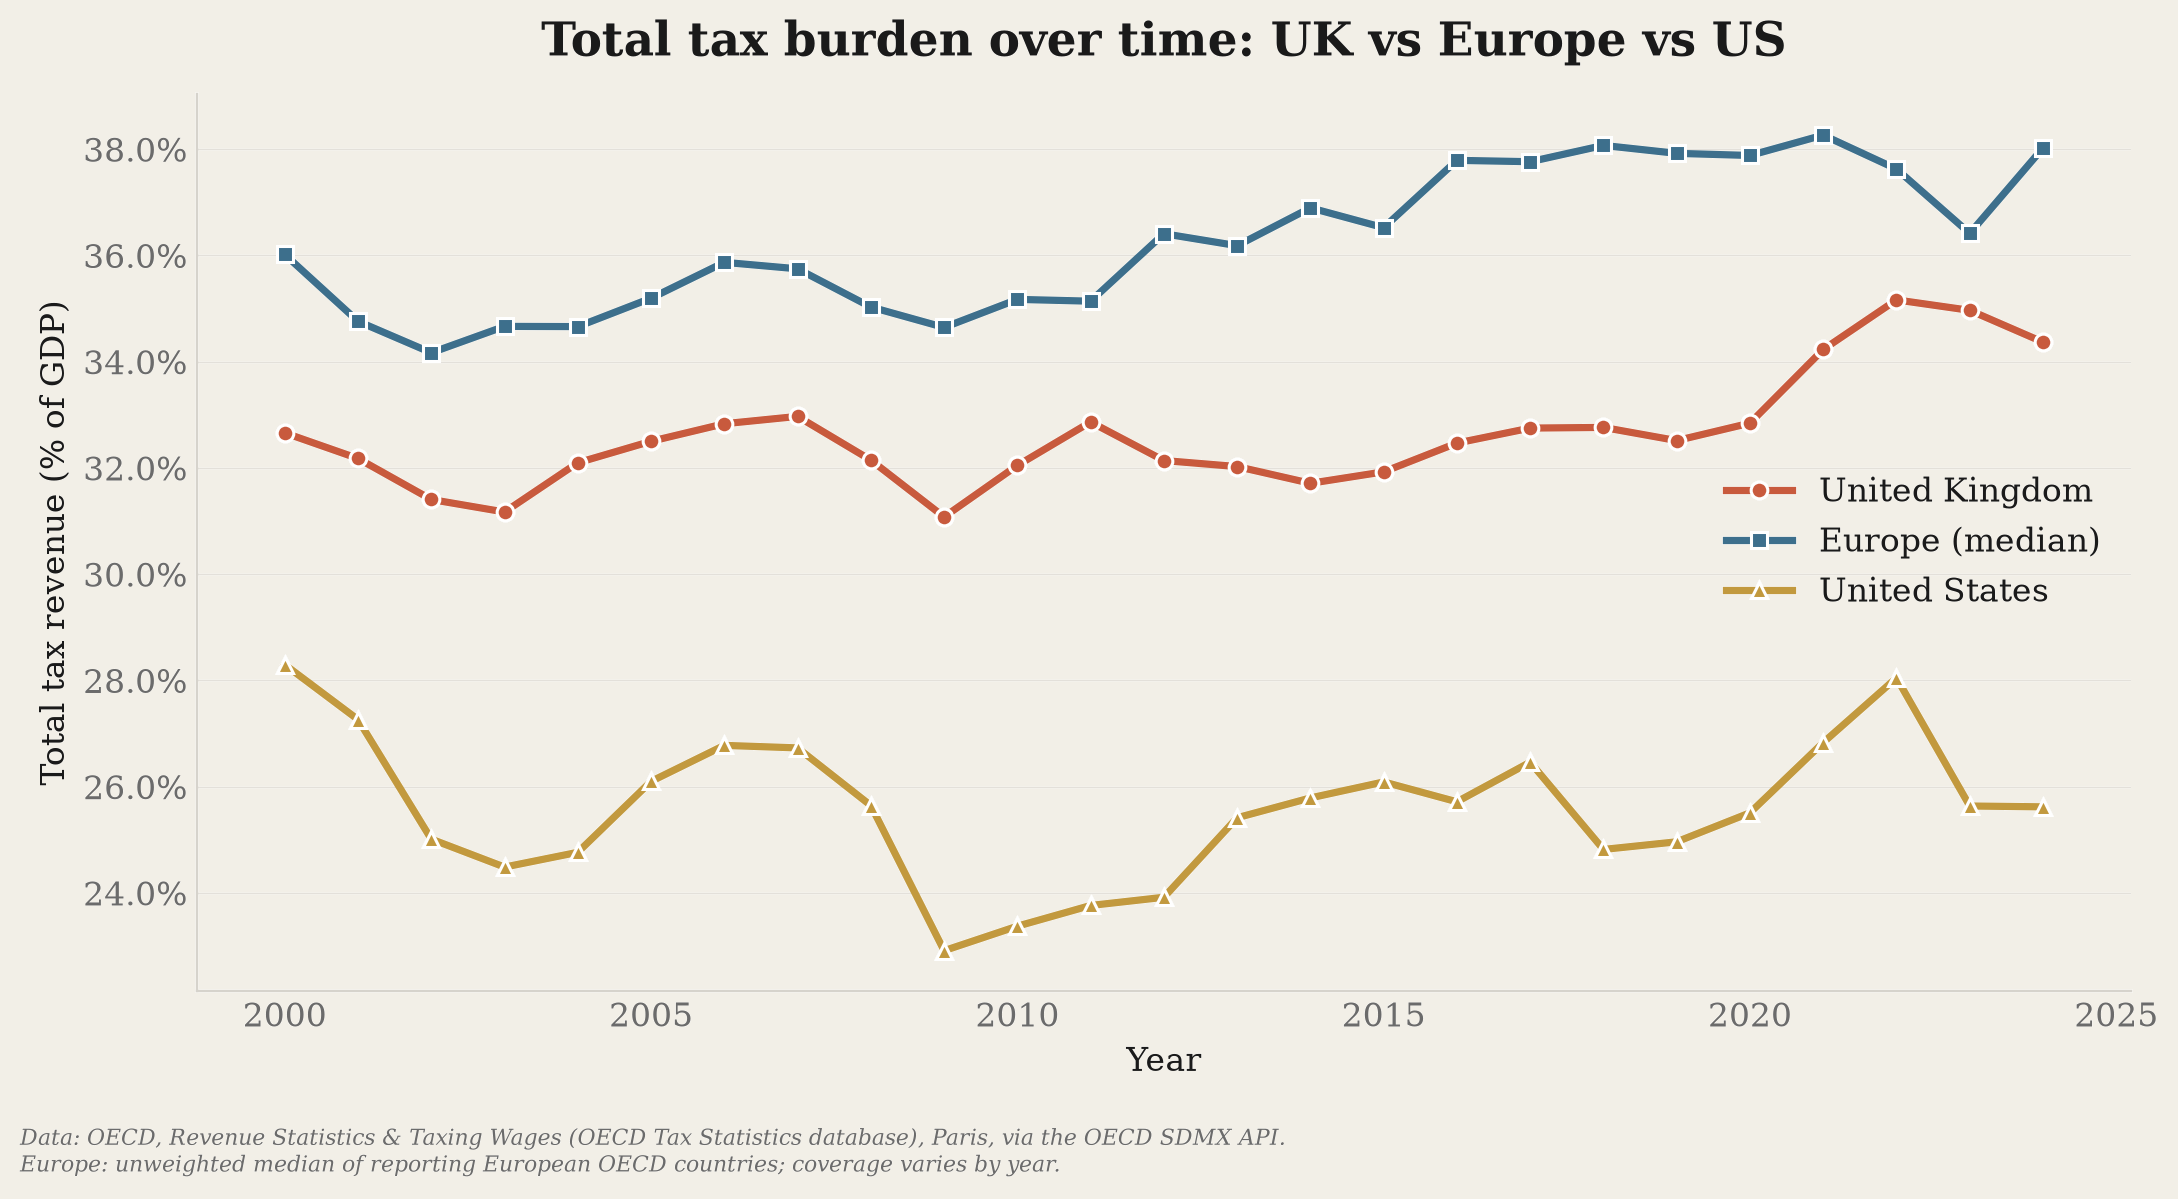
National tax revenue and household labour-tax wedges are different measures.
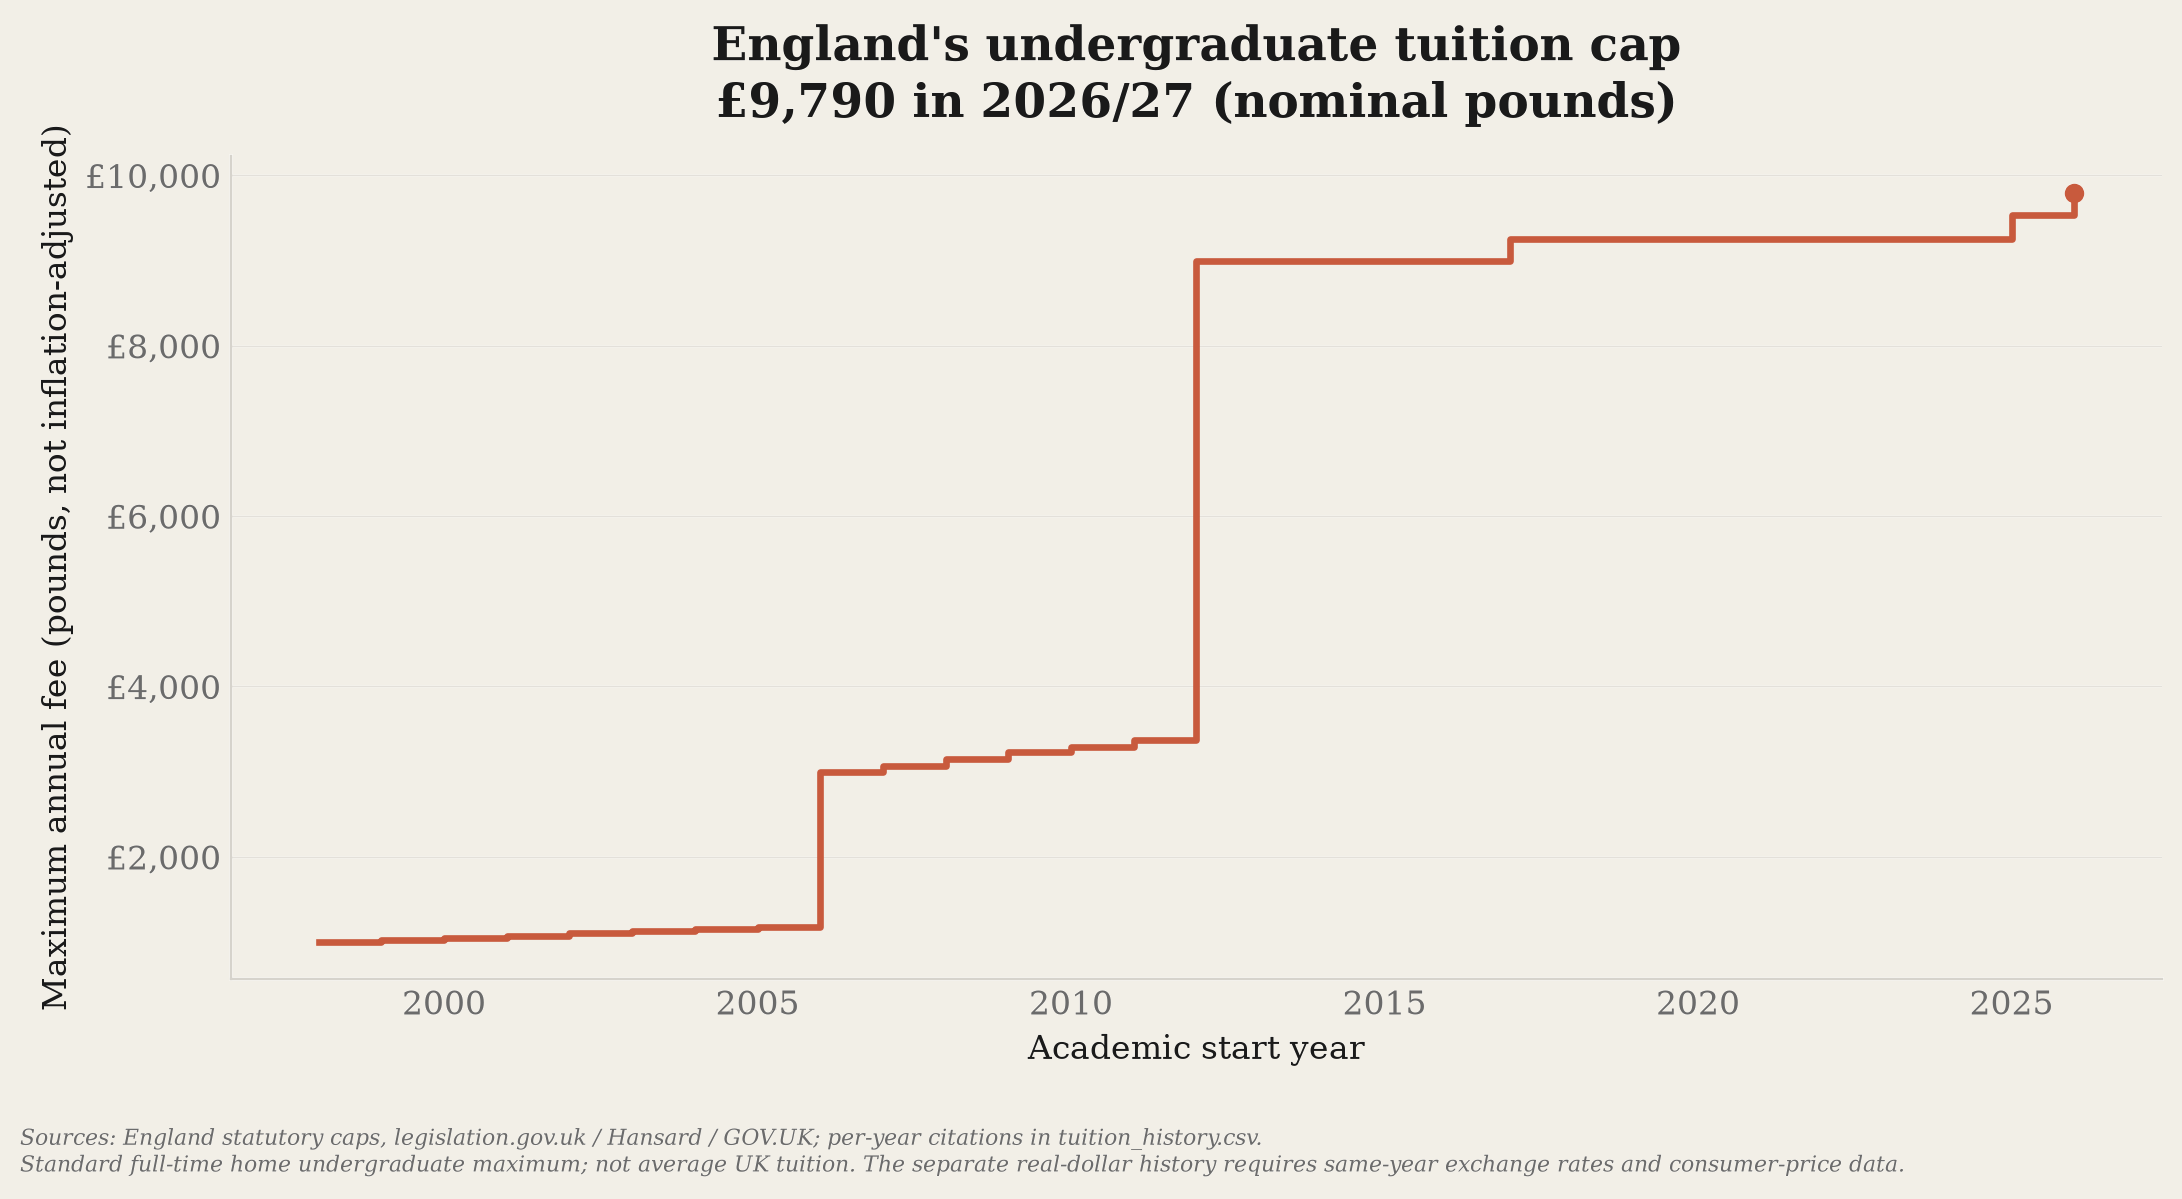
England's fee cap alongside dated US and European fee comparisons.
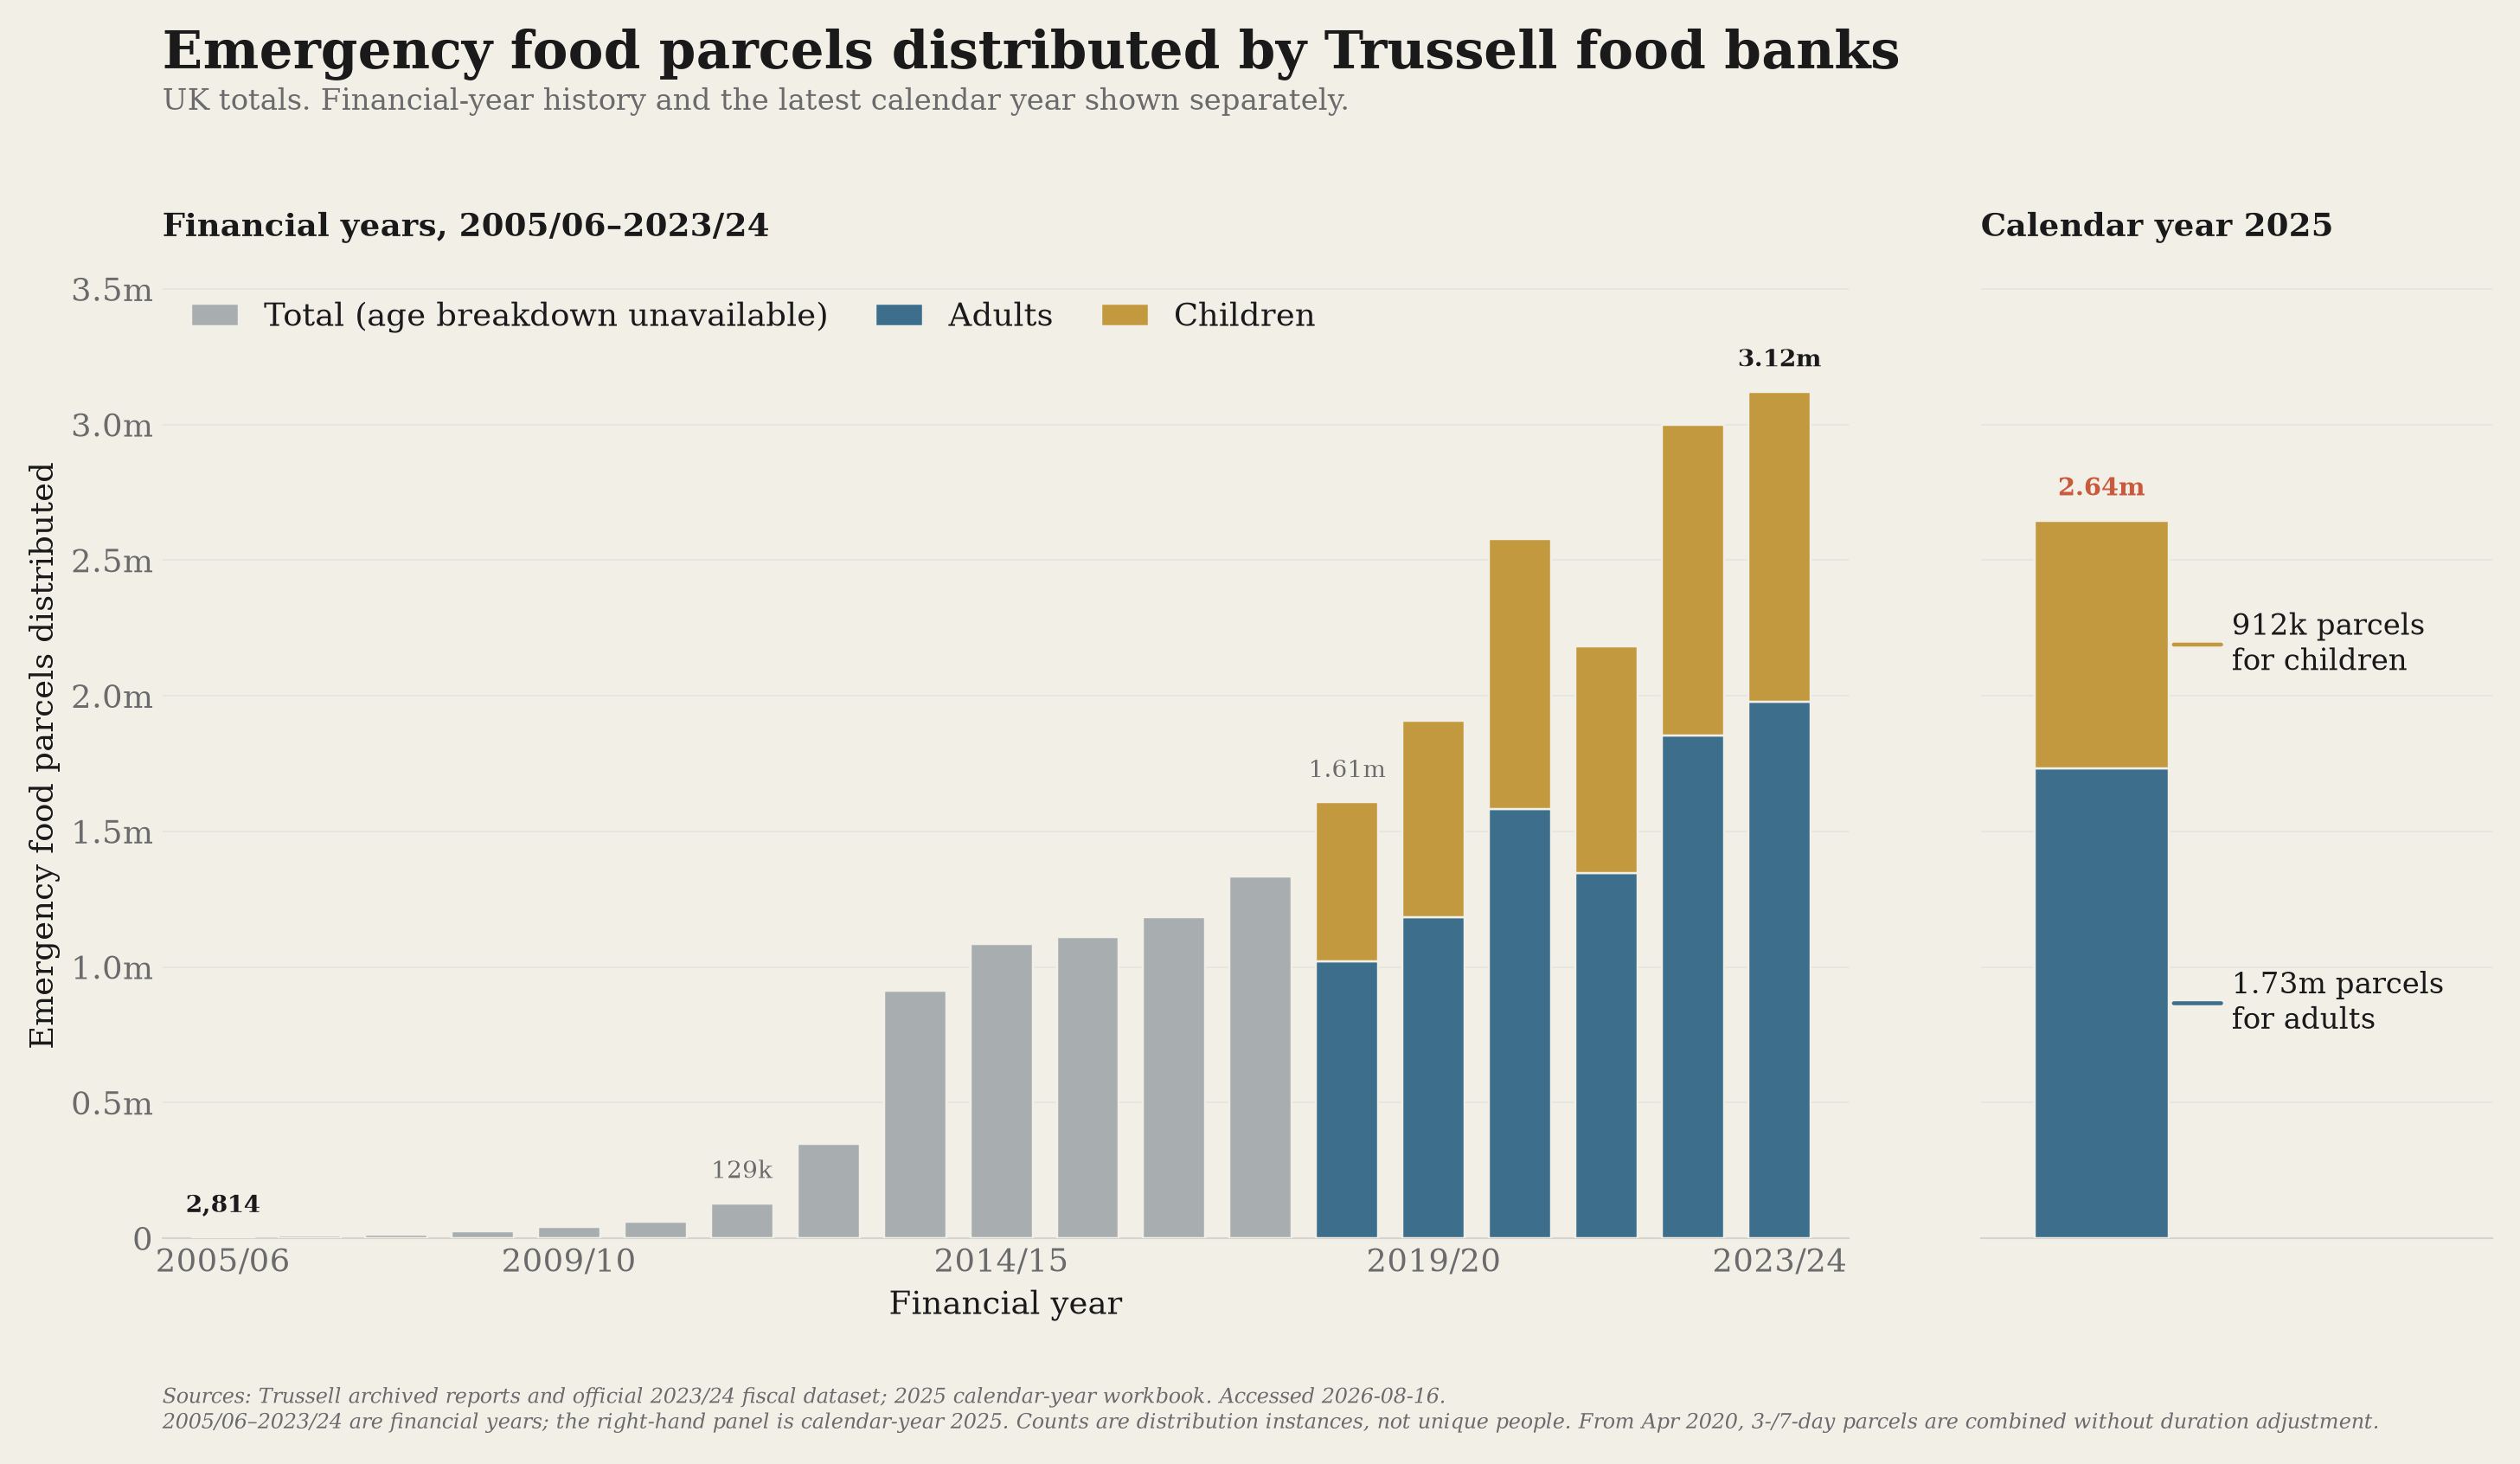
Trussell network parcel counts, not unique recipients or all UK food-bank provision.
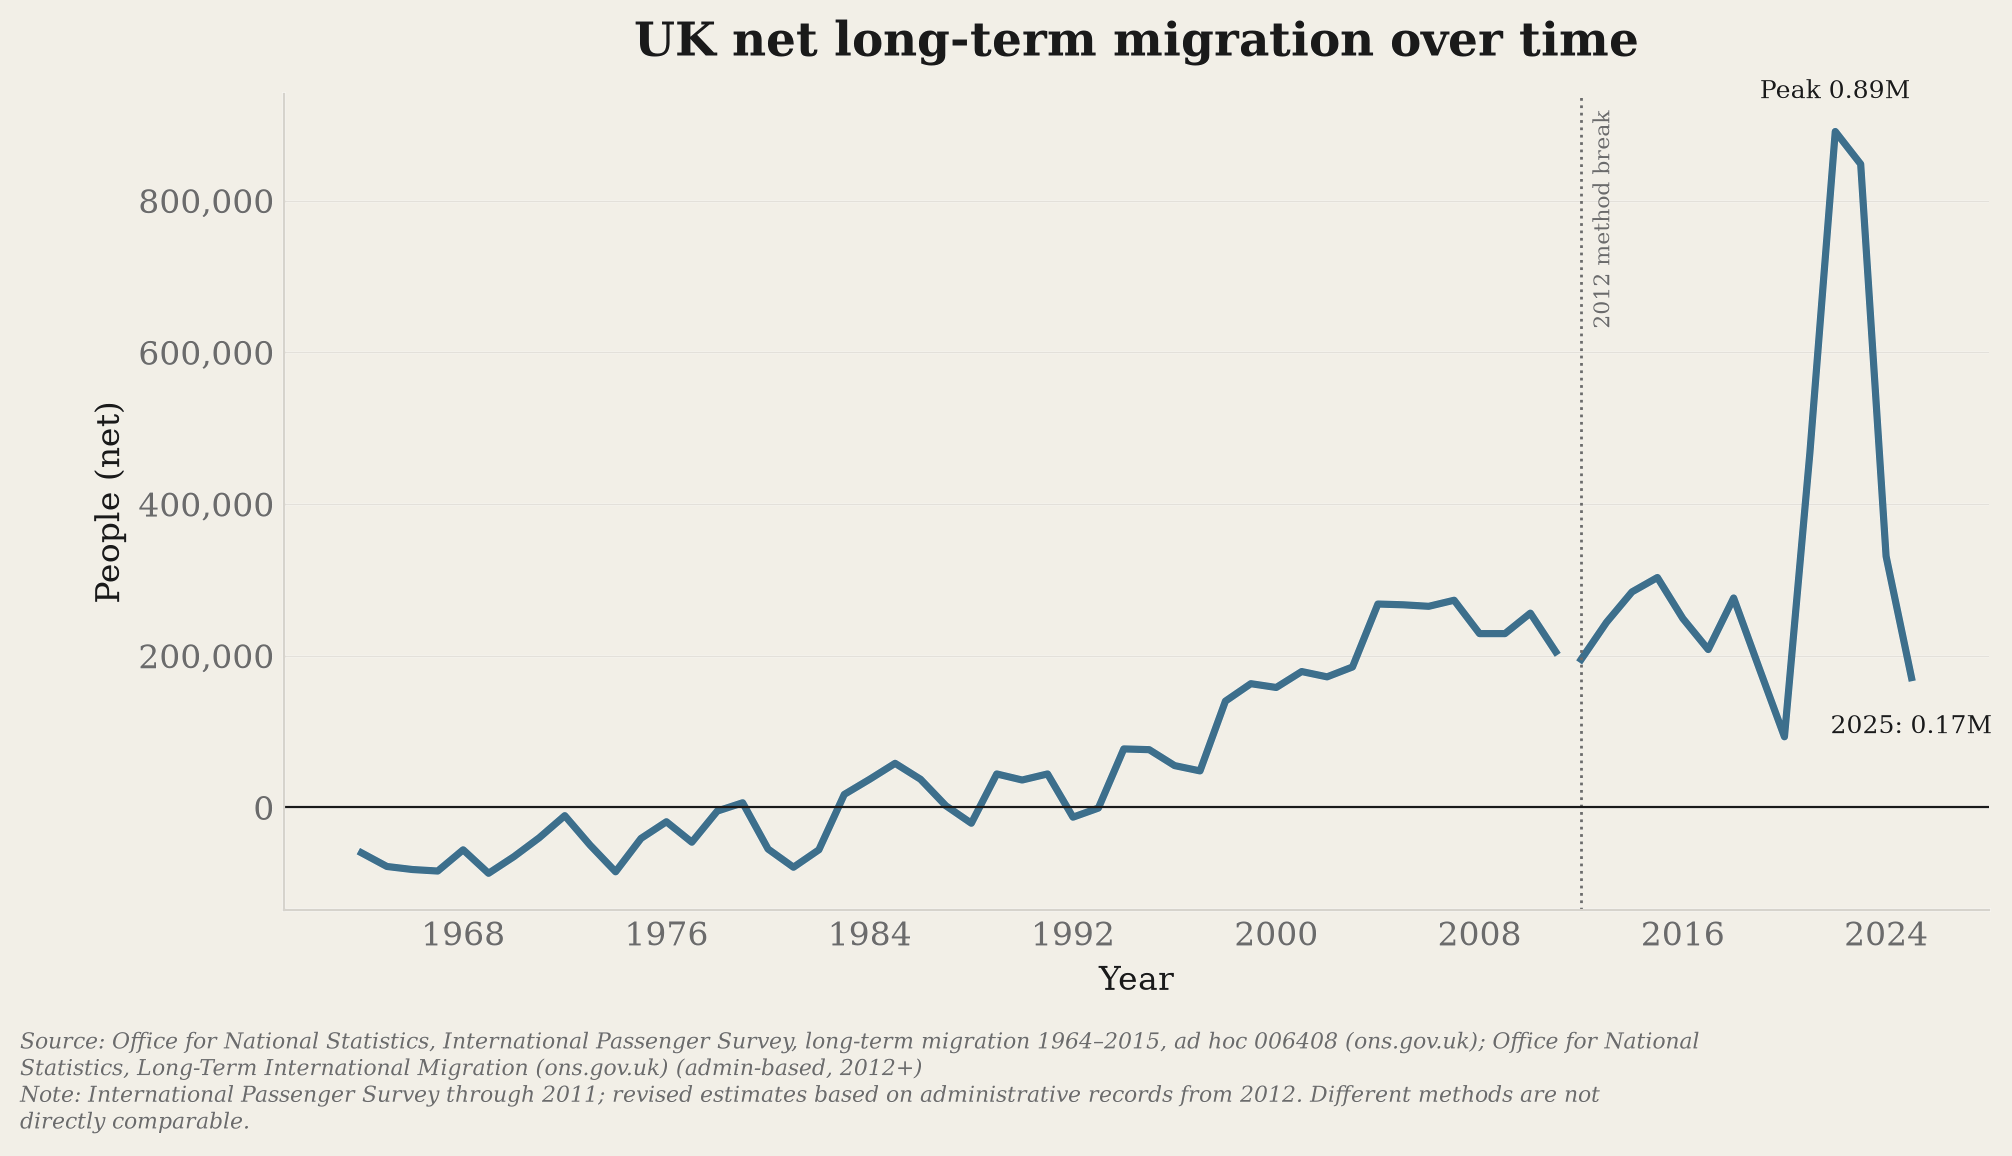
Immigration, emigration, visas and asylum, without conflating people and events.
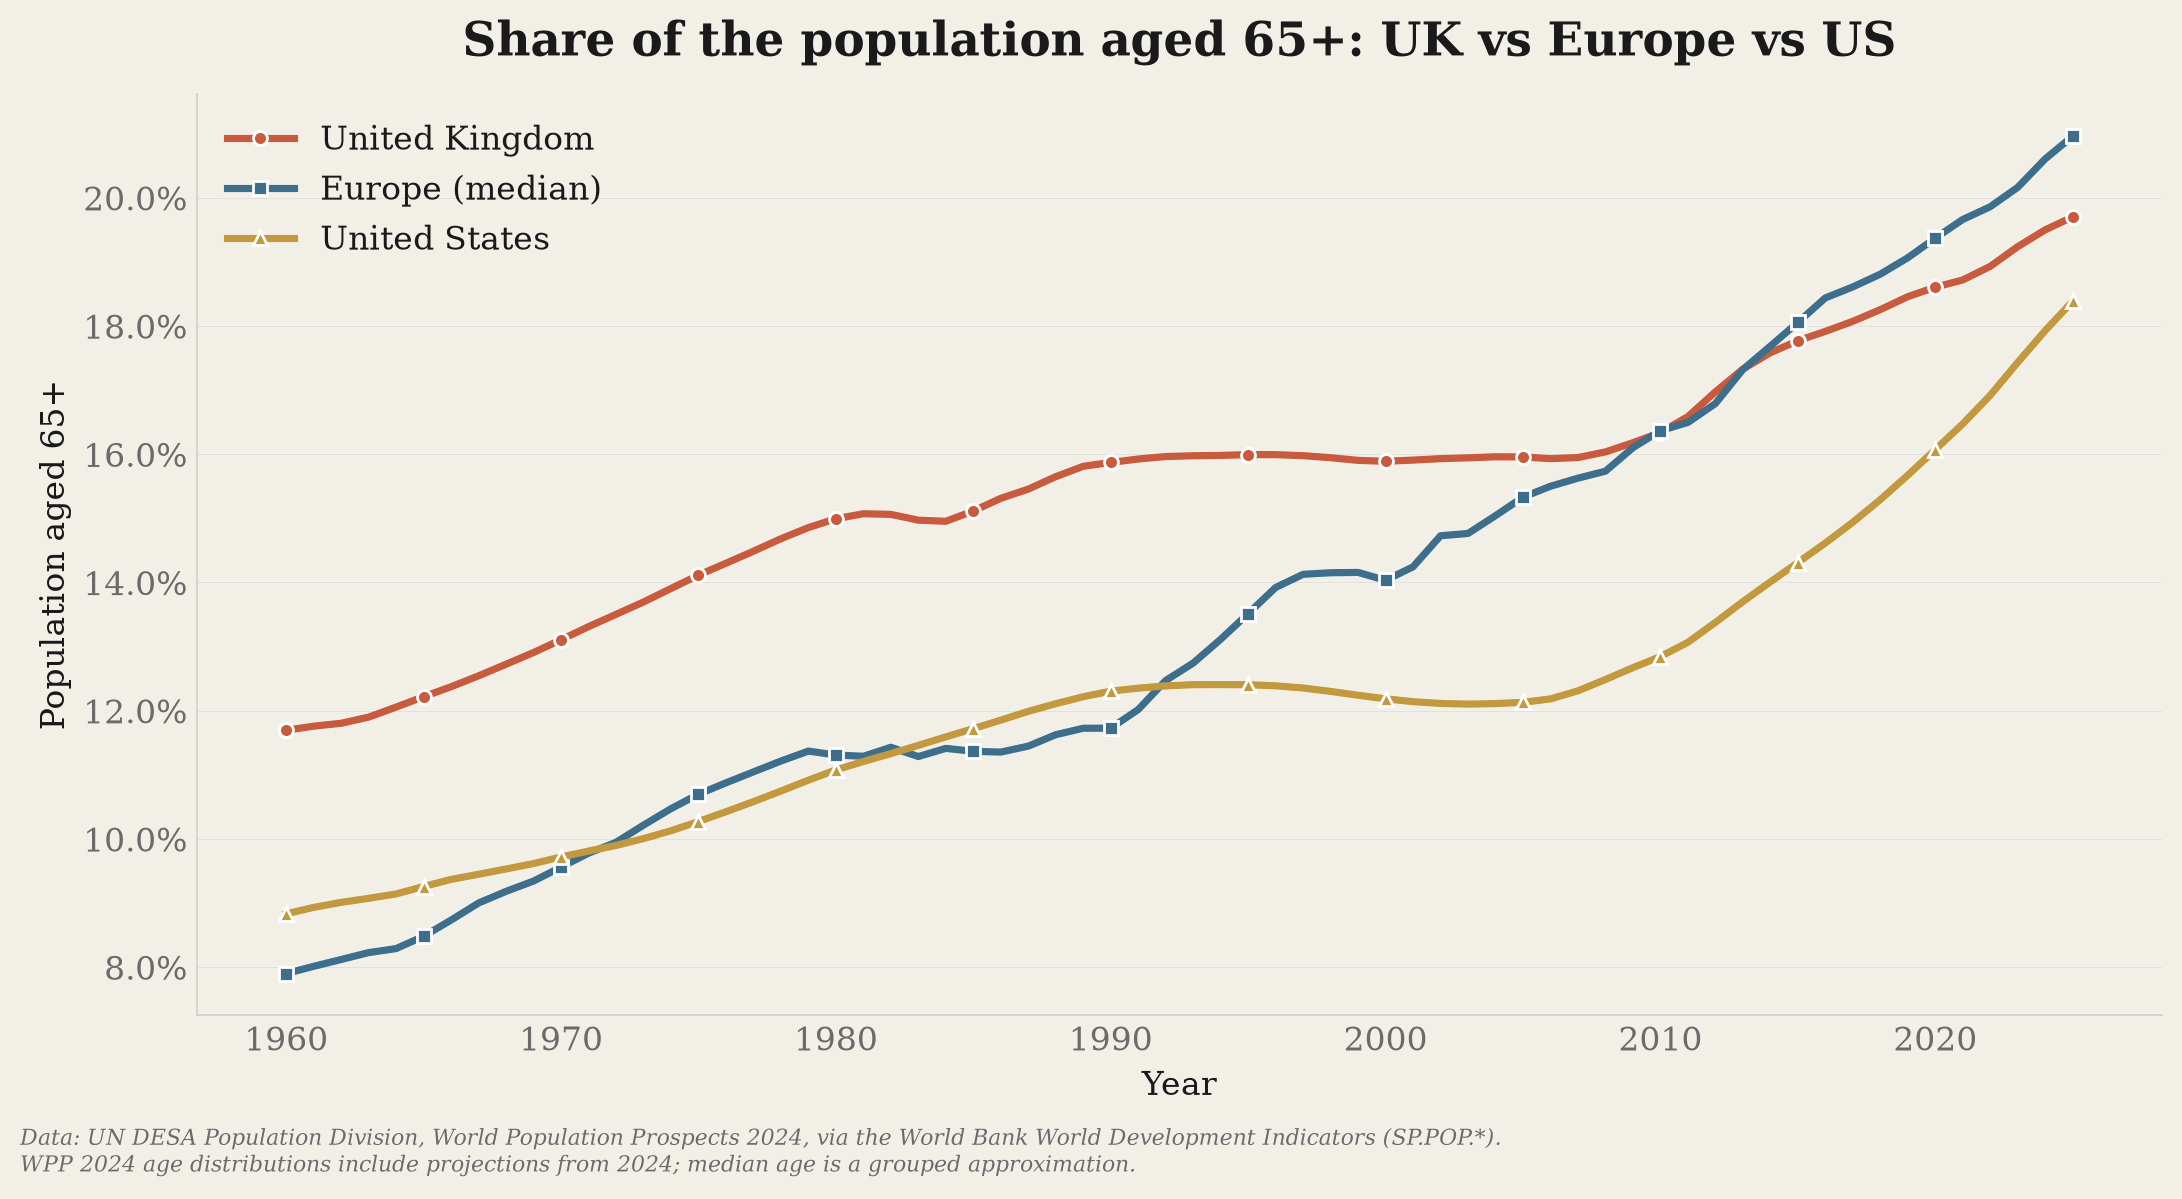
Population age structures and the changing share of older residents.
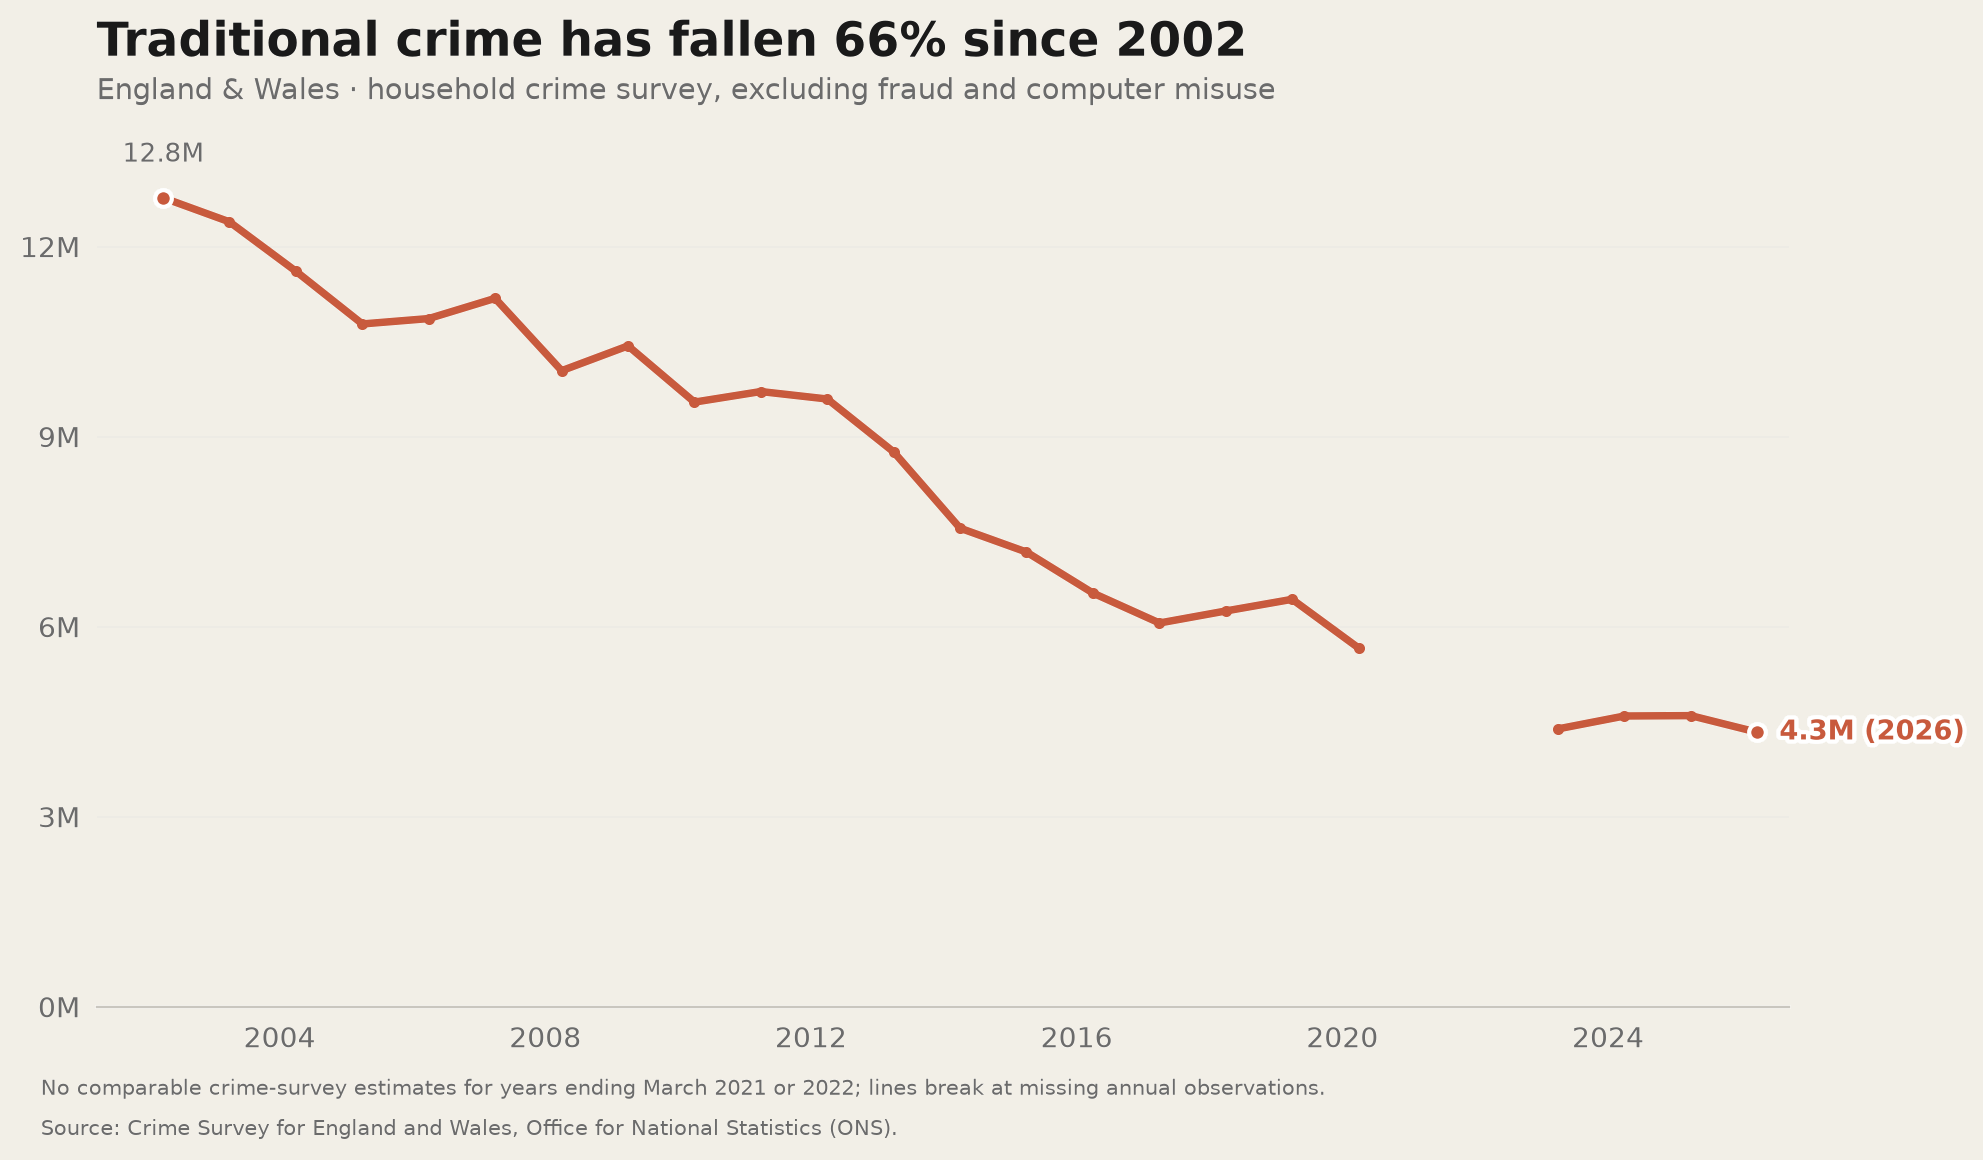
Survey incidents and homicide statistics, with geography and coverage made explicit.
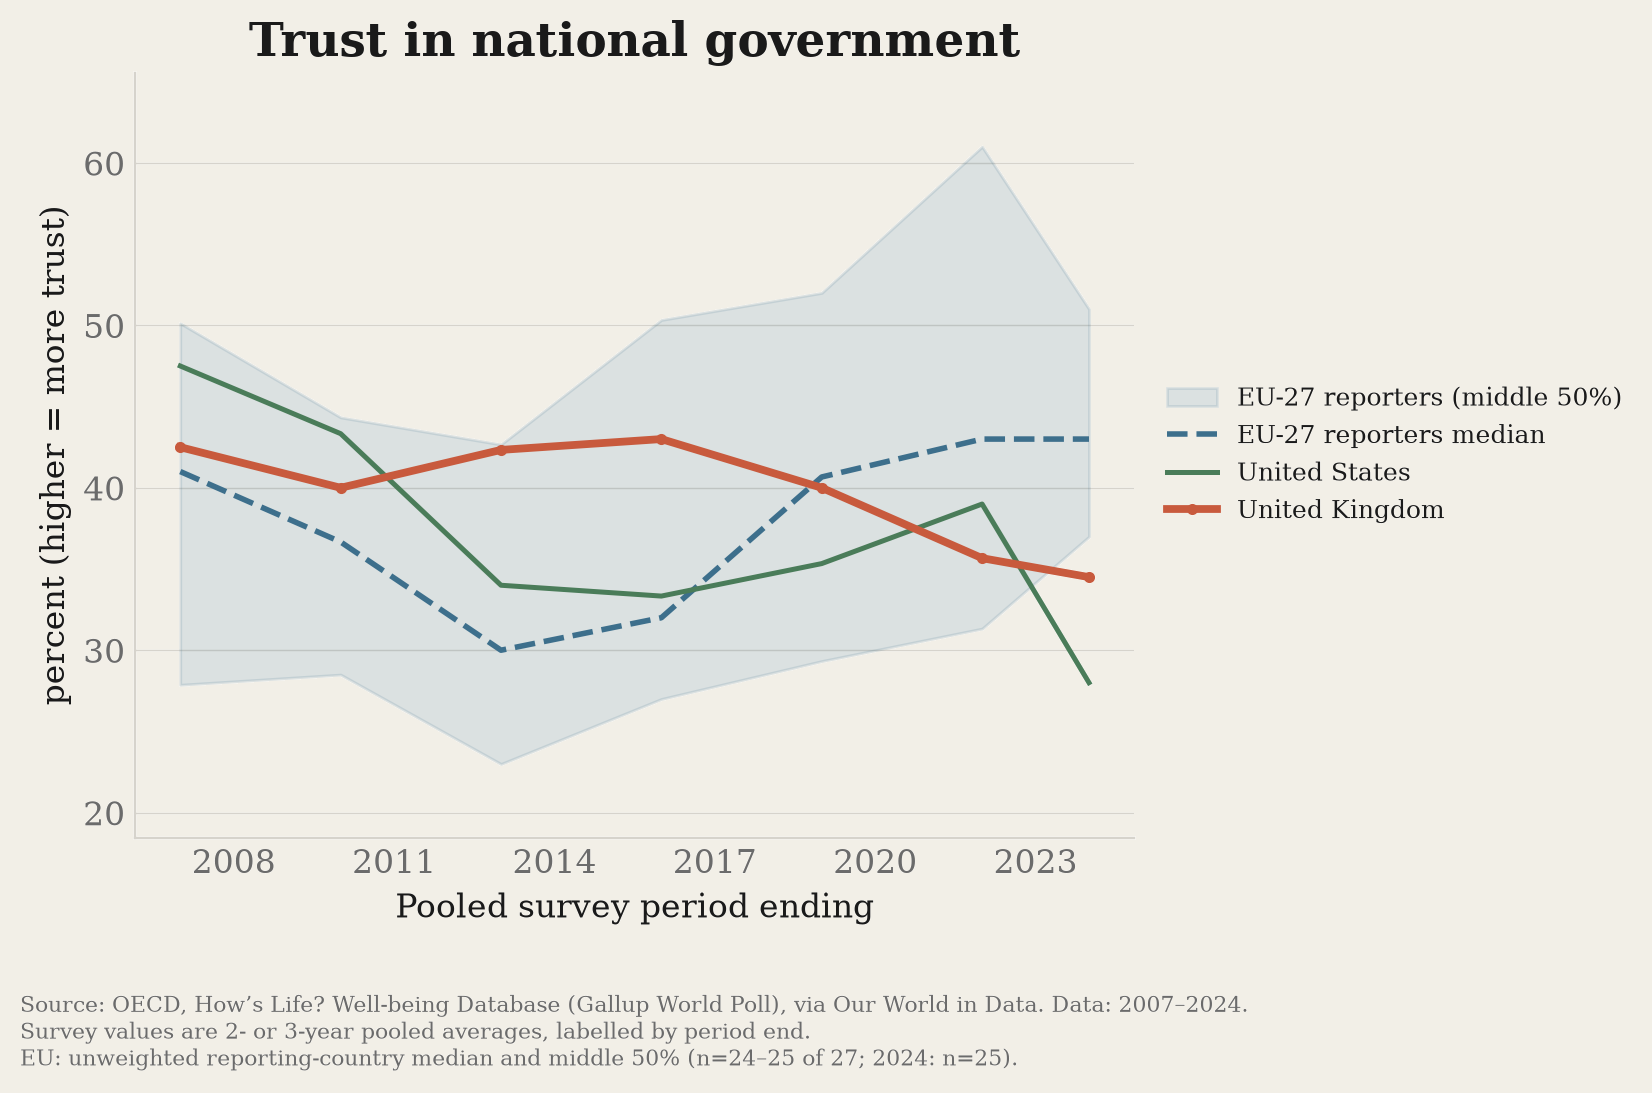
Survey trust and governance indicators, respecting collection and methodology changes.
No matching topics. Try another search or select all topics.